Monitoring Security
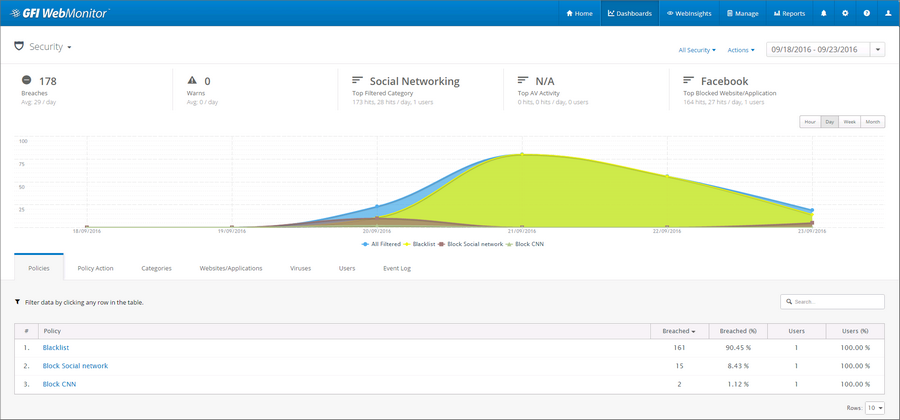
The Security dashboard provides information related to web requests and user activity for a specified period.
The information provided enables you to identify security risks and threats to your network environment at a glance.
Security DashboardEnables the user to obtain graphical and statistical information related to GFI WebMonitor operations. gives an overview of security issues on the network
To access this dashboard, click Dashboard > Security.
A report summary at the top provides the following information:
- Breaches
- Warns
- Top Filtered Category
- Top AV Activity
- Top Blocked Website/Application
Filter available data to provide information related to:
| Option | Description |
|---|---|
| All Security | Shows all activity made through GFI WebMonitor in the specified period. |
| Websites | Displays only security issues related to websites. |
| Applications | Displays only security issues related to application usage. |
| Period | Use the controls to switch between Hour, Day, Week or Month. |
| View by: |
Use the filter in the top right corner of the page to view data for a specific date range. |
The lower portion of the Security page provides a breakdown of the data monitored in the specified period. Click the available tabs to view information filtered by the following categories:
| Filter | Description |
|---|---|
| Policies | Affected policies are listed in this tab, together with the total number of Breaches and the name of the users who made the request. |
| Policy Action | The type of action taken by GFI WebMonitor. Can be Blocked or Warned. |
| Categories | Select to view a list of categories with total number of Breaches for each category. |
|
Websites/Applications |
A list of websites or Applications with respective total number of Breaches. Data can be viewed by Domain or by Site using the provided controls. |
| Viruses | A list of detected viruses, with the total number of Breaches. |
| Users |
A list of users and the total Breaches for a specified period, broken down under the following headings: Infected and Malicious. |
| Event Log |
Provides a log of all the web requests that fall within the specified period, displaying:
|
One-click Report Functionality
After you customize the dashboard, the view can be exported as a report or scheduled to be sent automatically as required.
Export Report
To export the report:
- From the top of the Dashboard, click Actions and select Export Report.
- GFI WebMonitor displays the exported report in a separate window in your browser.
- Click Save and select one of the following options:
| Option | Description |
|---|---|
| Excel | The report is exported in Microsoft Excel format (.xls) |
| The report is exported in PDF format. | |
| Word | The report is exported in Microsoft Word format (.doc) |
Schedule Report
To schedule the report:
- From the top of the Dashboard, click Actions and select Schedule Report.
- GFI WebMonitor redirects you automatically to the Reports area.
- Edit the report as required.
- Save the report.
For more information refer to Working with Reports.
IMPORTANT
If Anonymization is enabled, personal data (such as User Names and IPs) will be masked. For more information refer to Configuring Anonymization.