Monitoring Activity
The Activity dashboard provides information related to web requests and user activity for a specified period. To access the dashboard, click Dashboards > Activity.
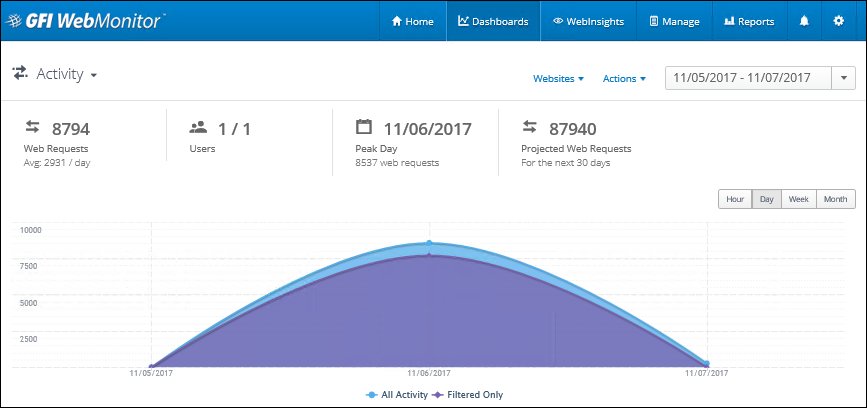
A report summary at the top provides the following information:
- Users
- Peak Day
- Requests
- Projected Requests
Filter dashboard data according to the following:
| Option | Description |
|---|---|
| All Activity | Shows all web requests (filtered and unfiltered) made through GFI WebMonitor in the specified period. |
| Websites | Displays only traffic related to websites. |
| Applications | Displays only traffic related to application usage. |
| Searches | Shows the activity related to searches performed by users. |
| Period | Use the controls to switch between Hour, Day, Week or Month. |
| View by: |
Use the filter in the top right corner of the page to view data for a specific date range. |
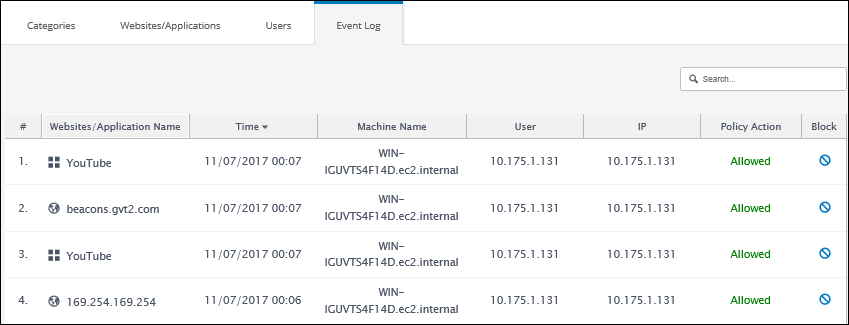
Event Log tab
The lower portion of the Activity page provides a breakdown of the data monitored in the specified period.
Data is broken down as follows:
| Filter | Description |
|---|---|
| Categories | Select to view a list of categories with total number of Requests for each category. |
|
Websites/Applications |
A list of websites and applications with information related to Requests. |
| Users |
A list of users and the total Surf Time and number of Web Requests for a specified period. NOTE Surf Time is an approximate time calculated by timing access to web sites. Every time a user accesses a website, 1 surf time minute will be added for that user. During this minute, the user can access other web sites without adding to the surf time. When the 1 minute has passed, another minute will be added if the user is still browsing. |
| Event Log |
When Logging is enabled in Policies, GFI WebMonitor provides a log of all the web requests that fall within a specified period, displaying:
NOTE The Event Log does not show any data when Logging is not enabled. For more information refer to Logging. |
One-click Report Functionality
After you customize the dashboard, the view can be exported as a report or scheduled to be sent automatically as required.
Export Report
To export the report:
- From the top of the Dashboard, click Actions and select Export Report.
- GFI WebMonitor displays the exported report in a separate window in your browser.
- Click Save and select one of the following options:
| Option | Description |
|---|---|
| Excel | The report is exported in Microsoft Excel format (.xls) |
| The report is exported in PDF format. | |
| Word | The report is exported in Microsoft Word format (.doc) |
Schedule Report
To schedule the report:
- From the top of the Dashboard, click Actions and select Schedule Report.
- GFI WebMonitor redirects you automatically to the Reports area.
- Edit the report as required.
- Save the report.
For more information refer to Working with Reports.
IMPORTANT
If Anonymization is enabled, personal data (such as User Names and IPs) will be masked. For more information refer to Configuring Anonymization.