Monitoring Bandwidth
The Bandwidth dashboard provides information related to traffic and user activity that affects bandwidth consumption.
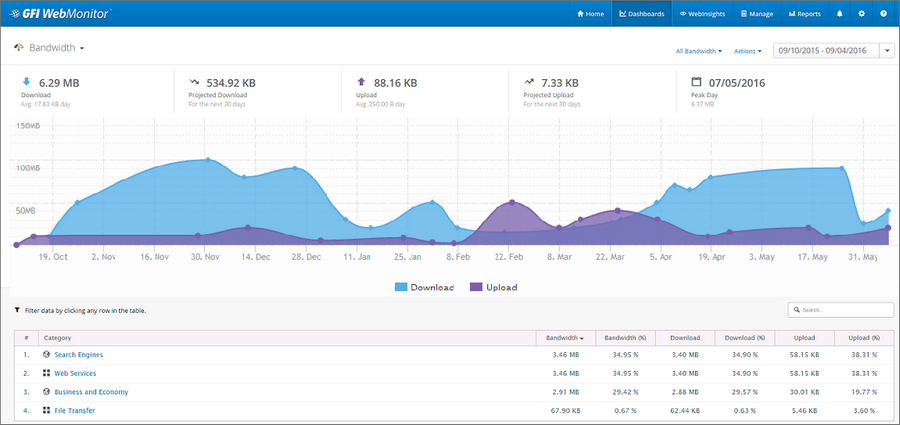
Bandwidth dashboard gives an overview of Internet activity.
To access the dashboard, click Dashboards > Bandwidth.
A summary at the top provides the following information:
- Download
- Projected Download
- Upload
- Projected Upload
- Peak Day
Filter DashboardEnables the user to obtain graphical and statistical information related to GFI WebMonitor operations. data according to the following:
| Option | Description |
|---|---|
| All Bandwidth | Shows download and upload traffic. |
|
Websites |
Displays bandwidth consumed by websites only. |
|
Applications |
Displays bandwidth consumed by applications only. |
| Download | Displays only downloaded traffic. |
| Upload | Displays only uploaded traffic. |
| Period | Use the controls to switch between Hour, Day, Week or Month. |
| View by: |
Use the filter in the top right corner of the page to view data for a specific date range. |
The lower side of the Bandwidth page provides a breakdown of the data monitored in the specified period.
Data is broken down as follows:
| Filter | Description |
|---|---|
| Categories | Select to view a list of categories and bandwidth consumption for each category. |
|
Websites/Applications |
A list of websites and applications with information related to bandwidth consumption. |
| Users | A list of users and bandwidth consumption information for a specified period. |
| Event Log |
A log of all the web requests for a single day, displaying:
|
One-click Report Functionality
After you customize the dashboard, the view can be exported as a report or scheduled to be sent automatically as required.
Export Report
To export the report:
- From the top of the Dashboard, click Actions and select Export Report.
- GFI WebMonitor displays the exported report in a separate window in your browser.
- Click Save and select one of the following options:
| Option | Description |
|---|---|
| Excel | The report is exported in Microsoft Excel format (.xls) |
| The report is exported in PDF format. | |
| Word | The report is exported in Microsoft Word format (.doc) |
Schedule Report
To schedule the report:
- From the top of the Dashboard, click Actions and select Schedule Report.
- GFI WebMonitor redirects you automatically to the Reports area.
- Edit the report as required.
- Save the report.
For more information refer to Working with Reports.
IMPORTANT
If Anonymization is enabled, personal data (such as User Names and IPs) will be masked. For more information refer to Configuring Anonymization.