Security Insights
The Security Insights dashboard provides information related to malicious activity and infected files for a specified period. The information provided enables you to identify security risks and threats to your network environment at a glance.
To access the dashboard, click WebInsights > Security.
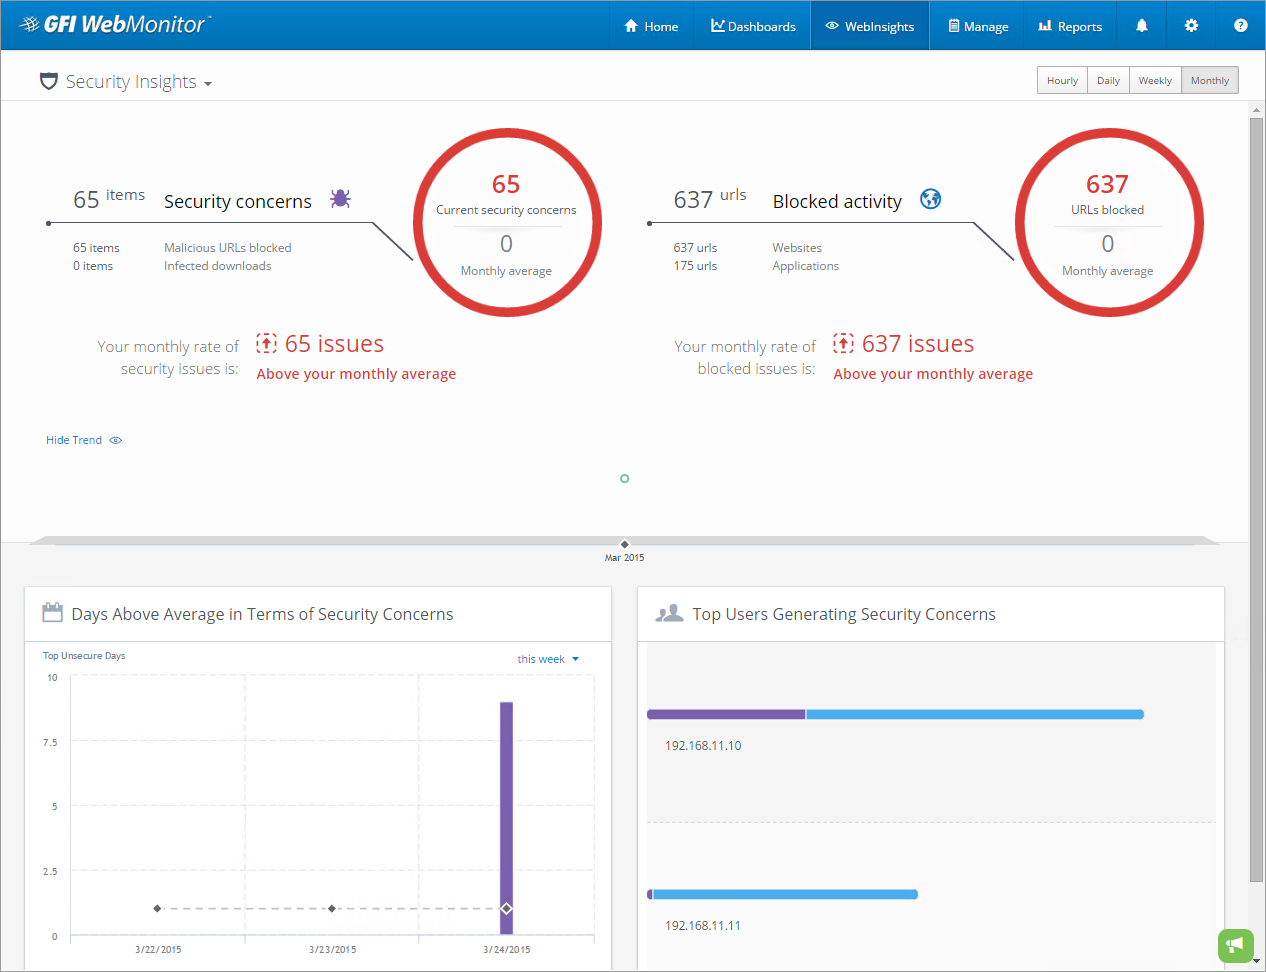
Security Insights dashboard
NOTE
Use the View by: filter in the top right corner of the page to view data for a specific date range.
A summary at the top provides the following information:
- Security concerns broken down between blocked malicious URLs and infected downloads.
- Blocked requests broken down between websites and applications.
- Trend - this graph shows the peaks and lows of actual security issues compared to the average consumption for the same period. Move the cursor over the graph to display the amount of issues for the selected period.
The lower portion of the WebInsights Security dashboard is composed of two widgets:
- The Days Above Average in Terms of Security Concerns widget shows on which days of the week your network experienced security concerns that were above average. Toggle the view between results for this week or for the previous week.
- The Top Users Generating Security Concerns widget displays a list of users that are accessing content that is creating security concerns to your organization.
IMPORTANT
If Anonymization is enabled, personal data (such as User Names and IPs) will be masked. For more information refer to Configuring Anonymization.