Productivity Insights
The Productivity Insights dashboard provides information related to web requests and user activity for a specified period. The information helps you quantify your losses in terms of productivity and identify potential unproductive users, enabling you to take adequate action.
To access the dashboard, click WebInsights > Productivity.
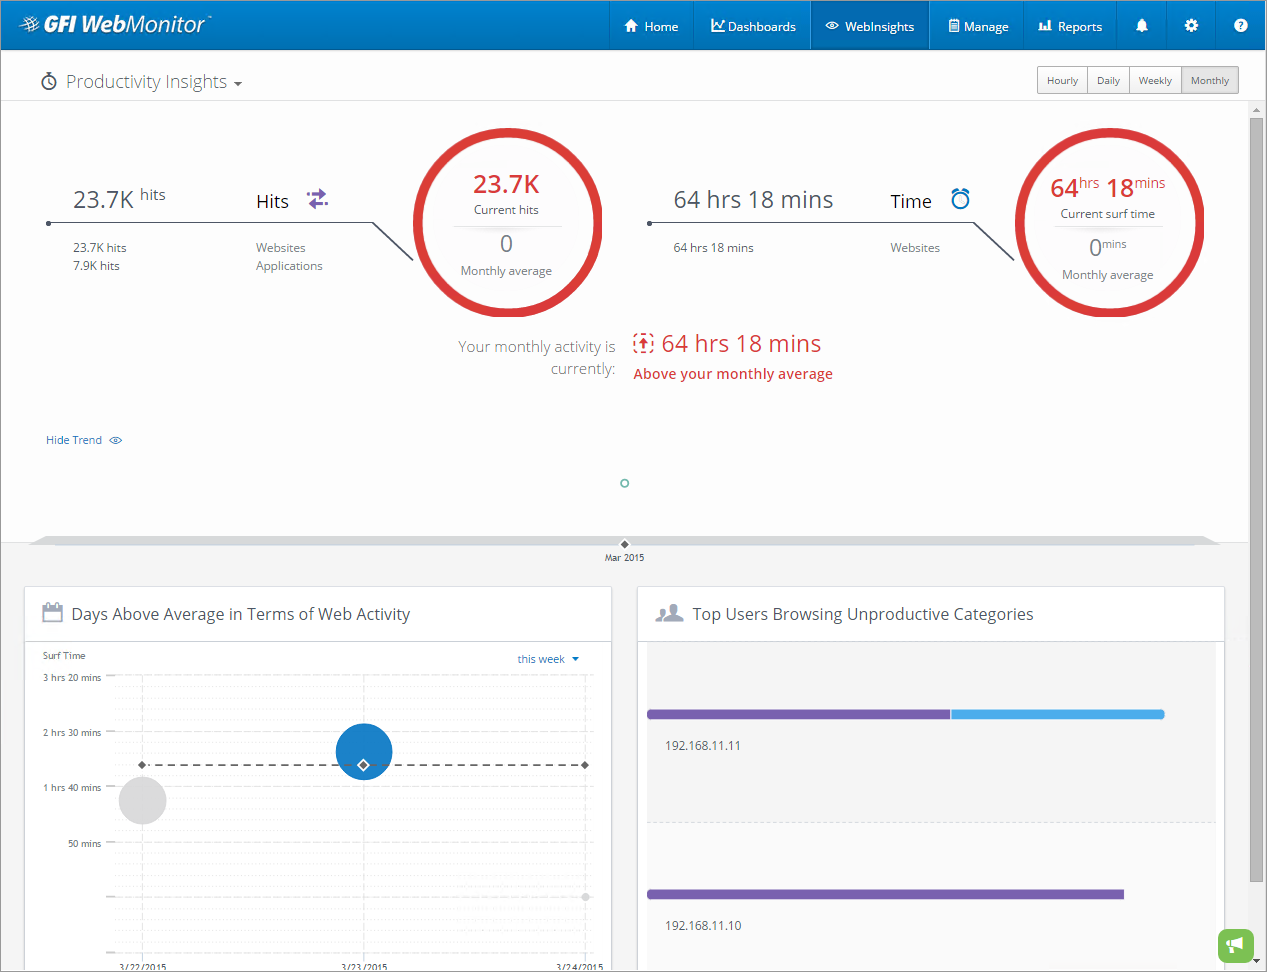
Productivity Insights dashboard
NOTE
Use the View by: filter in the top right corner of the page to view data for a specific date range.
A summary at the top provides the following information:
- Number of hits on websites and applications in the Productivity Loss category.
- Time spent on websites and applications in the Productivity Loss category.
- An estimate of productivity loss compared to the average for the same period.
- Trend - this graph shows the peaks and lows of productivity loss compared to the average for the same period. Move the cursor over the graph to display the projected loss on the selected period.
The lower portion of the WebInsights Productivity dashboard is composed of two widgets:
- The Days Above Average in Terms of Web Activity widget compares current productivity loss with the previous period averages. The period changes according to the filtering option selected.
- The Top Users Browsing Unproductive Categories widget displays a list of users that browse sites that belong to unproductive categories.
IMPORTANT
If Anonymization is enabled, personal data (such as User Names and IPs) will be masked. For more information refer to Configuring Anonymization.