Phase 2 - Day 9 to Day 15 – Analyze!
Now that you have a week’s worth of browsing data it is time to check out what is going on in the organization. Find out how people are using the Internet to identify any problematic users or websites, and start deciding on how to tackle any issues.
Access monitoring reports
Start by analyzing the activity of the first 7 days of the trial.
1. Go to Dashboards > Bandwidth.
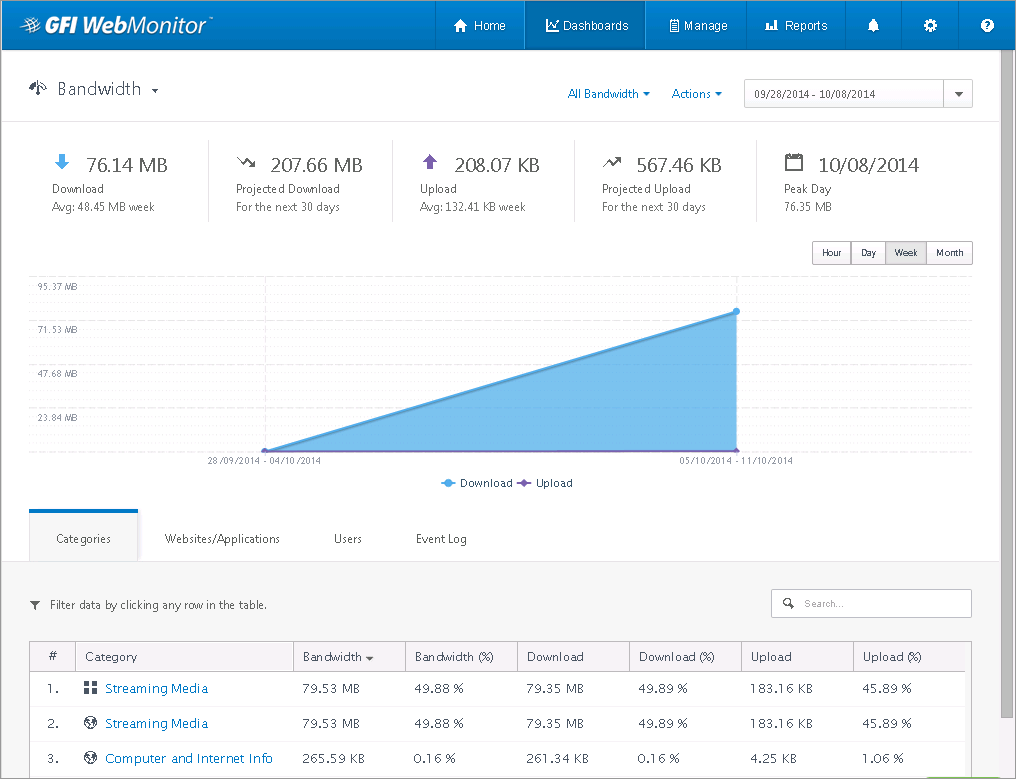
Bandwidth dashboard
2. Use the calendar to select the days when GFI WebMonitor was monitoring traffic.
3. You will now see a chart of what has happened in terms of downloaded and uploaded traffic. Perform the following actions:
- Click the Download or Upload switches underneath the graph for a more specific analysis.
- Using the tabs underneath the chart, you can see which Categories consumed the most bandwidth.
- Switch to the Websites/Applications or Users tab to see the websites or users that consumed the most bandwidth.
- The information nuggets at the top also give you the projected download and upload for the whole month based on current data.
4. To analyze further, simply click on the Category, Website/Application or User that interests you, and the data will be filtered by the item you have chosen. You can progressively drill down until you arrive to the data you require. You can also sort by any column, and search using the tab. Remove the current filter by clicking Clear Filters in the right-hand sidebar.
NOTE
Although Bandwidth information may be of particular interest to IT Administrators, you can also make a mark by showing the same type of reports based on Activity and Surf Time to relevant management persons.
5. Switch dashboards using the controls in the top left corner of the UI. Select the Activity dashboard.
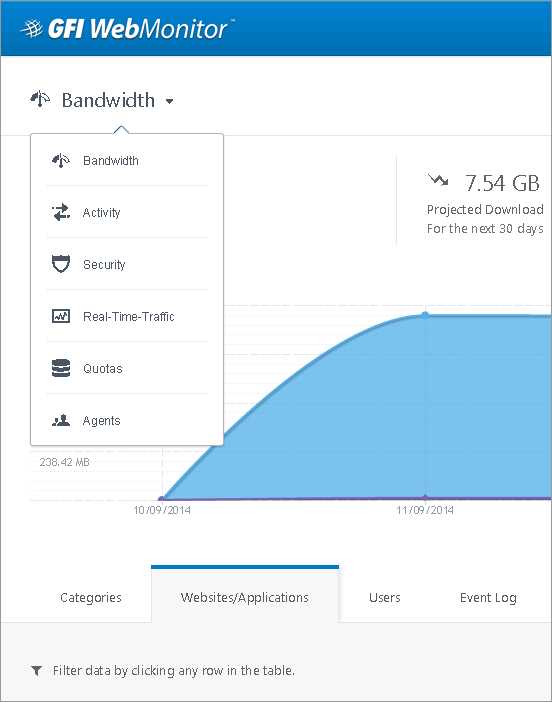
Switching between dashboards
6. When browsing the Activity reports, keep an eye out for specific categories such as: “Abused Drugs”, “Gambling”, “Hacking”, “Job Search” and other questionable content. If you see any objectionable activity, it is recommended you go to the relevant person and advise them of the situation.
7. If there is little activity to see, then you need to add more users to build up data. No data is displayed in the Activity > Filtered Only reports if you have not put any blocks in place.
NOTE
Show the reporting capabilities of GFI WebMonitor on your computer, or via the web interface to interested managers. The drill-down feature gives you so much flexibility in quickly finding out what is happening on your company Internet connection.
Start talks with stakeholders
By now, you have some idea of common issues in your organization. You should now start thinking about introducing some control. Start discussions with stakeholders following the reports you have shown them. Until discussions are concluded, keep monitoring, and add more users if necessary.