Answers to common questions about Solution Center Application Performance
What type of data is available in an Application Performance report?
An Application Performance report shows the network user experience of an application through a series of charts, tables and graphs.
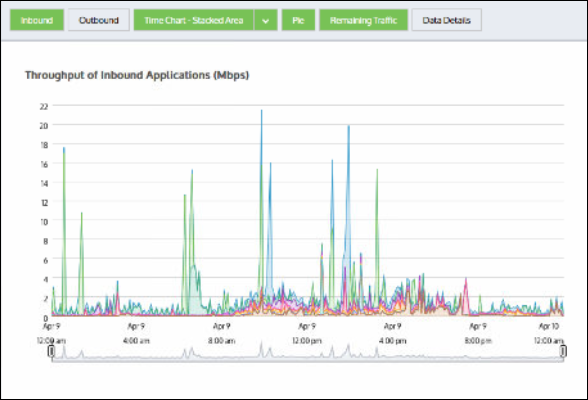
Inbound bandwidth application
The Inbound and Outbound Bandwidth charts show how much bandwidth the application is using. You should expect the bandwidth to show spikes instead of raised flat tops. Flat tops in the graph often indicate traffic may be limited by policy rules.
The chart shows data measured on the WANWide Area Network-side of the appliance before accelerated traffic is decompressed for inbound traffic and after acceleration and traffic shaping policies have been applied for outbound traffic.
You can overlay the data measured on the LANLocal area network-side of the appliance to show the amount of reductionmeasures the amount of redundant data that has been removed from the network, increasing capacity achieved due to acceleration and traffic shaping.
The users and hosts bar charts show the WAN-side data volumes consumed by the top users and hosts for the application. Typically, applications are used by multiple users or hosts and the traffic distribution is fairly even amongst the top users or hosts.
If one user or host shows considerably more data volume than the other users, it may be reasonable behavior or it may indicate a problem worthy of further investigation. Also, you can choose to show just internal endpoints, that is, hosts and users on the LAN-side of your appliance, or just external endpoints, that is, hosts and users on the WAN-side of your appliance. You can also choose to show just users, just hosts, or both.
Application Performance Score Metrics You should expect a good score (between 8.5 and 10.0). If the score is less than 7.0, you may want to investigate.
 What is Application Performance report baselining?
An Application Performance monitor requires a baselineused by monitors and performance reports to establish a standard by which sunsequent performance can be measured understanding of observed traffic for an application in your network. The process of collecting data and setting a baseline is called baselining.
Once you create a monitor, the baselining operation starts automatically analyzing traffic and begins the process of computing initial threshold values. This process requires an hour's worth of network traffic data.
If no traffic is observed for an application during a baselining period, the baselining process repeats until traffic is observed and thresholds are calculated.
The baselining process may not always take an hour if an Exinda Appliance has observed and stored traffic for the application within the hour the baselining process starts.
For example, if you create an application monitor with ten minutes left in an hour and the Exinda captured network traffic for the application in that hour, the baselining process analyzes the previous fifty minutes of collected traffic data. It then completes the baseline period in the remaining 10 minutes of the hour.
What if the Solution Center indicates there are no solutions?
The solution descriptions are served up from an Exinda hosted server. If your Exinda Solution Center indicates there are no solutions, check for Internet connectivity and connectivity to the Exinda hosted server. If the Exinda hosted server is down, previously instantiated solutions will still be available in your Solution Center.
What if a solution requires a higher Exinda OS version?
The solution's Run button won't be available until you upgrade your Exinda OS to the appropriate version or higher.
Can I run a solution more than once?
Yes. You can run a solution multiple times if the solution takes configuration parameters. For instance, you can create multiple Custom Application Performance monitors where each report monitors a different application. For solutions without configuration parameters, such as VoIP Performance, you cannot create the solution more than once.