Using Application Performance reports
Application Performance monitors generate reports that display information about application users, application performance, application bandwidth consumption, and the amount of reductionmeasures the amount of redundant data that has been removed from the network, increasing capacity achieved (if applicable).
Application Performance solutions provide a predefined set of application monitors. Except for VoIP, application monitors generate similar reports.
You can choose a monitor from the main Exinda Solution Center screen or click the Custom Application Performance link to bring up a list of applications to choose from.
NOTE
The report description lists the minimum version of Exinda OS required to run the report. If your Exinda OS does not meet the requirement, the Run button is not be available.
Running an Application Performance report
The Exinda Solution Center lists a set of predefined reports on the Solution Center main screen. You can choose to run one of those or you can choose to run one of the dozens of other reports by clicking Custom Application Performance.
- Go to Solution Center > Show Solution Center.
- Under Application Performance, click the name of the report to run
- Click Run. A confirmation screen opens.
- Click Ok.
NOTE
After the initial run, you can access the report by clicking Solution Center, hovering over Applications and clicking the report name.
Understanding the data displayed in an Application Performance report
An Application Performance report shows the network user experience of an application through a series of charts, tables and graphs.
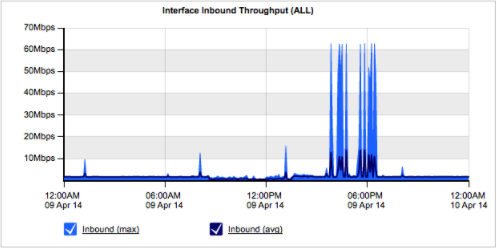
The Inbound Bandwidth chart shows data measured in the WANWide Area Network-side before accelerated traffic is decompressed.
The Inbound and Outbound Bandwidth charts show how much bandwidth an application uses. Chart lines typically show spikes instead of raised flat tops. Flat tops may indicate traffic limitations imposed by policy rules.
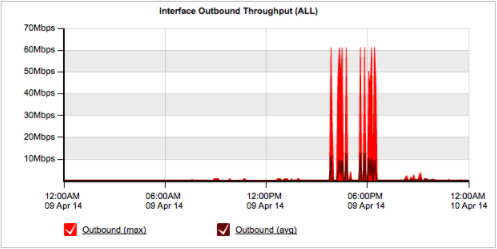
The Outbound Bandwidth chart shows data measured after acceleration and traffic shaping policies have been applied.
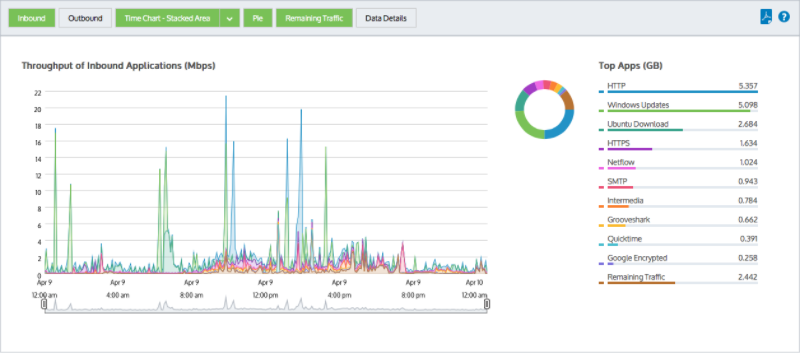
Users and hosts bar charts.
Users and Hosts bar charts display bandwidth volume by top listeners and talkers. Multi-user applications typically show an even distribution among top users or hosts. If a user or host displays more bandwidth volume than other users and hosts, that situation may warrant investigation.
You can choose to show internal endpoints (LANLocal area network-side of an Exinda Appliance), external endpoints (WAN-side of an Exinda Appliance), users only or hosts only. For more information refer to Monitoring real time application response.
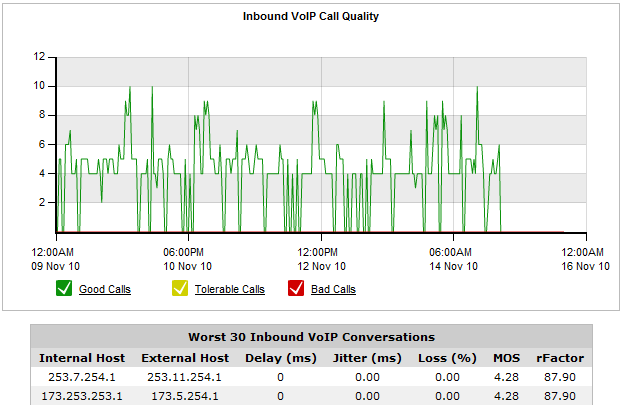
The Application Performance Scores and Metrics table.
Application Performance Scores and Metrics displays the APSApplication Perfromance Score score for the application. A good score is between 8.5 and 10.0. A score less than 7.0 may warrant an investigation.