Using the Application Performance Monitor VoIP report
The VoIP report monitors and reports on the quality of VoIP transactions in a network. It displays data using telecommunication industry standard measures like MOS and rFactor.
Running the Application Performance VoIP report
- On your browser, open the Exinda Web UI (
https://Exinda_IPInternet protocol_address). - Key-in the User and Password.
- Click Login.
- Go to Solution Center > Show Solution Center.
- Under Application Performance, click VoIP Performance > Run. A confirmation screen opens.
- Click Ok. The report opens.
NOTE
After the initial run, you can access the report by clicking Solution Center > VoIP Performance.
Understanding the data displayed in an Application Performance VoIP report
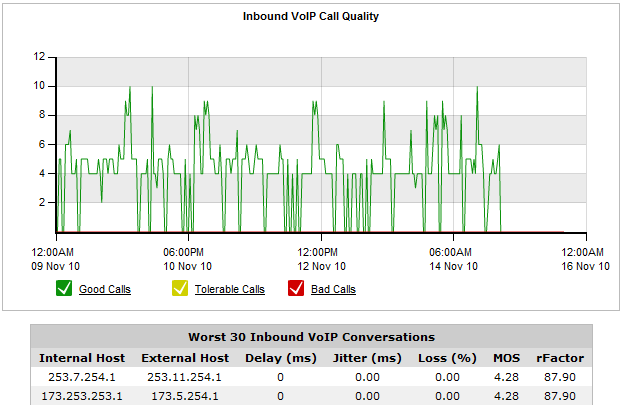
The graph shows three series, representing the number of "Good", "Tolerable" and "Bad" calls over time. The table below the chart lists the worst quality inbound and outbound VoIP calls for the specified time period.
The meanings of the colors:
- Good (green) - MOS greater than 4.
- Tolerable (yellow) - MOS between 2 and 4.
- Bad (red) - MOS less than 2.
 What is MOS?
MOS, or Mean Opinion Score, is a measure of all quality. Historically, users would rate their call experience on a five point scale.
An Exinda Appliance automates MOS ratings, taking into account network dependency conditions. The scores have the following meanings.
5 - Perfect, like face-to-face conversations or radio reception.
4 - Fair, imperfections perceived, but the sound is clear. Cell phones calls are typically rated fair.
3 - Annoying.
2 - Very annoying, nearly impossible to communicate.
1 - Impossible to communicate.
What is rFactor?
rFactor is a measure of the call quality in IP networks taking into account network delay and impairments. rFactor ranges from 0 (extremely poor quality) to 100 (high quality). Any rFactor less than 50 is not acceptable.