Monitoring real time application response
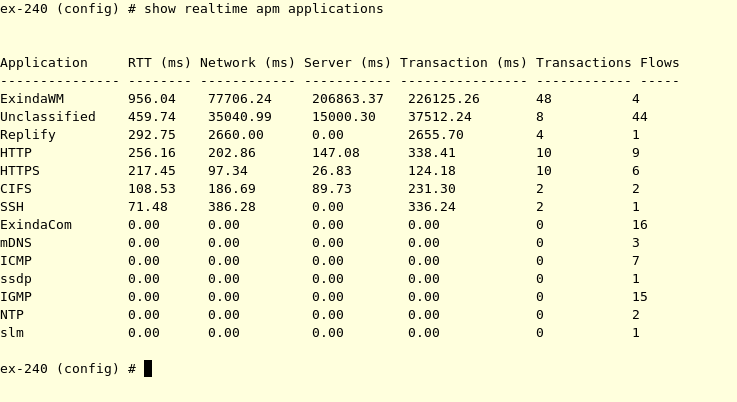
The APM values are available as a real time display. The real time display shows the APM values by application for the selected time period. As well as the APM values, the number of flows and the number of transactions are shown.
- On your browser, open the Exinda Web UI (
https://Exinda_IPInternet protocol_address). - Key-in the User and Password.
- Click Login.
- Click Monitor > Real Time and switch to the Application Response tab.
The following report opens:

- To change how often the table is refreshed, select an Auto-Refresh Rate from the list.
- On your browser, open the Exinda Web UI (
https://Exinda_IP_address). - Key-in the User and Password.
- Click Login.
- Click Configuration > System > Tools > Console.
- Type the appliance username and password at the prompts. Do one of the following:
- To enter privileged EXEC (enable) mode, at the prompt run the command:
hostname > enable
The hostname # prompt appears.
- To enter configuration (config) mode, at the prompt run the commands:
hostname # configure terminal
The hostname (config)# prompt appears.
- To display real time APM data from the CLICommnad line interface, use the following command:
(config) # show realtime apm applications
The following results are displayed:
