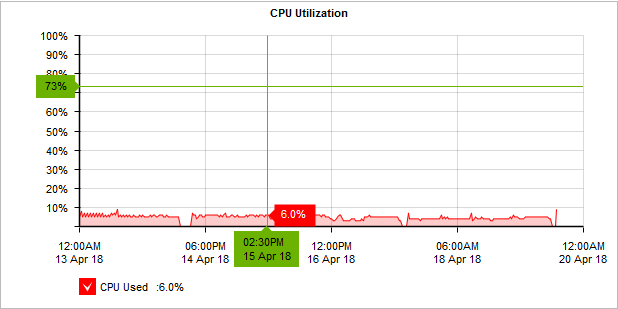
Monitoring Exinda Appliance CPU usage
The CPU Usage report shows how hard the CPU is working over time.
This report answers questions such as:
- Are some of the other issues I'm seeing with my traffic due to overworking the appliance?
- I see the appliance's CPU is highly utilized. What traffic issues could cause this to be happening?
High CPU usage may be due to a variety of processing intensive traffic characteristics:
- The number of new connections per second is high
- The number of accelerated connections is high
- The appliance is encountering more accelerated traffic than it can handle. If this is the case, latency can be introduced when the appliance queues the packets for acceleration and cannot process them fast enough. Using virtual circuits, you can limit the amount of accelerated traffic to process.
- The appliance is encountering more analysis-intensive traffic than it can handle. For instance, VoIP traffic is CPU intensive due to the processing required to compute the metrics such as rFactor, MOS, jitter, etc.
To diagnose a CPU usage problem, for each period where the CPU usage is high, compare with the Connections report, the Accelerated Connections report, the Reduction report, and the VoIP Solution report.

The CPU utilization graph shows how hard the Exinda Appliance works over time.
To access the report:
- On your browser, open the Exinda Web UI (
https://Exinda_IPInternet protocol_address). - Key-in the User and Password.
- Click Login.
- Go to Monitor > System > CPU Usage.
Monitoring reports can be exported as a PDF document, saved as a scheduled report, or can be printed directly from the Web UI. For more information refer to Exporting, printing and scheduling reports.
- The report for number of new connections can be found at Monitor > System > Connections. For more information refer to Monitoring connections to an Exinda Appliance.
- The report for the number of accelerated connections can be found at Monitor > System > Accelerated Connections. For more information refer to Monitoring accelerated connections.
- The report for the amount of accelerated traffic can be found at Monitor > Optimization > Reduction. For more information refer to Monitoring traffic reduction.
- The report for VoIP traffic can be found in the Solution Center (Solution Center > Show Solution Center). For more information refer to Using the Application Performance Monitor VoIP report.
- To understand how to get a better look at traffic patterns and to remove clutter on the time graph, see Using Interactive Time Graphs.
- To understand how to set the desired time range for a chart, see Setting the Time Range.
- To understand how to print the report or schedule the report, see Printing and Scheduling Reports.