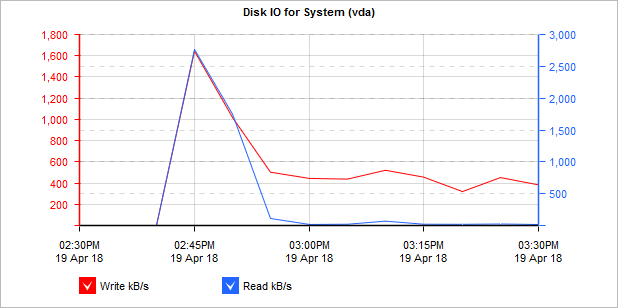
Monitoring Exinda Appliance Disk IO
The Disk IO report shows read and write disk usage for each service in kB/s over time for the selected time period.
This report answers questions such as:
- Has my disk I/O usage suddenly increased or over time? If so, which subsystem is responsible for the increased disk I/O usage?
- If WANWide Area Network memory acceleration, or CIFS acceleration, or edge cache performance is suffering, was there a decrease in its I/O load?
- Was that decreased I/O load due to another subsystem's increased I/O load?
- I swapped an appliance and loaded the same configuration and it seems slower. If all the I/O rates look lower, then maybe this is a physical disk issue.
The disk usage for each of the following services can be shown by selecting the desired service from the Service selector.
- System (vda) – Total disk usage for all services combined for the single disk; Note that there may be two disks.
- monitor – Disk usage required for storing the monitoring data
- swap – Disk usage required for swapping/paging
- users – Disk usage required to store the username information (i.e. data sent by the AD connector, manually configured users and groups, details of dynamic network objects)
- wan – memory - Disk usage required for WAN memory acceleration techniques
- edge-cache – Disk usage required for storing cached content for Edge Cache
- cifs – Disk usage required for CIFS acceleration techniques
The Disk IO graph displays IO used by edge cache.
To access the report:
- On your browser, open the Exinda Web UI (
https://Exinda_IPInternet protocol_address). - Key-in the User and Password.
- Click Login.
- Go to Monitor > System > Disk IO.
Monitoring reports can be exported as a PDF document, saved as a scheduled report, or can be printed directly from the Web UI. For more information refer to Exporting, printing and scheduling reports.
- To understand how to get a better look at traffic patterns and to remove clutter on the time graph, see Using Interactive Time Graphs.
- To understand how to set the desired time range for a chart, see Setting the Time Range.
- To understand how to print the report or schedule the report, see Printing and Scheduling Reports.