Monitoring connections to an Exinda Appliance
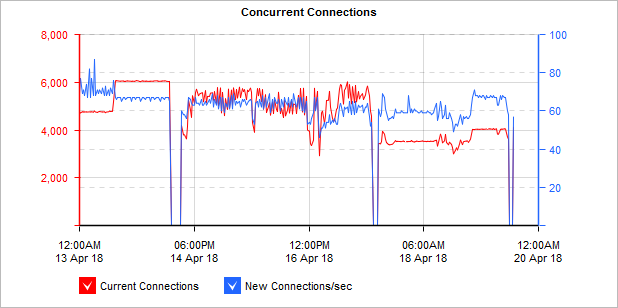
The Connections report shows the number of concurrent connections as well as the connection establishment rate over time for the selected time period.
This report answers questions such as:
- Is there an unusual number of connections or is the connection rate particularly high?
- Could I be experiencing some form of denial of service attack or network problem?”
NOTE
Systems reporting unusually high spikes in the number of connections or rate of connections may be experiencing a denial of service attack or network problem.

The Concurrent Connections graph displays connection statistics over time.
To access the report:
- On your browser, open the Exinda Web UI (
https://Exinda_IPInternet protocol_address). - Key-in the User and Password.
- Click Login.
- Go to Monitor > System > Connections.
Monitoring reports can be exported as a PDF document, saved as a scheduled report, or can be printed directly from the Web UI. For more information refer to Exporting, printing and scheduling reports.
- To understand how to get a better look at traffic patterns and to remove clutter on the time graph, see Using Interactive Time Graphs.
- To understand how to set the desired time range for a chart, see Setting the Time Range.
- To understand how to print the report or schedule the report, see Printing and Scheduling Reports.