Monitoring Exinda Appliance swap space usage
The Swap Usage report shows how much the appliance is swapping over time for the selected time period.
This report answers questions such as:
- Could excessive swapping be affecting the performance of my appliance?
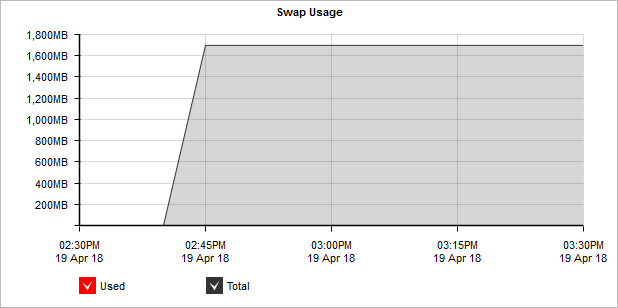
The Swap Usage graph displays system swap space utilization over time.
To access the report:
- On your browser, open the Exinda Web UI (
https://Exinda_IPInternet protocol_address). - Key-in the User and Password.
- Click Login.
- Go to Monitor > System > Swap Usage.
Monitoring reports can be exported as a PDF document, saved as a scheduled report, or can be printed directly from the Web UI. For more information refer to Exporting, printing and scheduling reports.
- To understand how to get a better look at traffic patterns and to remove clutter on the time graph, see Using Interactive Time Graphs.
- To understand how to set the desired time range for a chart, see Setting the Time Range.
- To understand how to print the report or schedule the report, see Printing and Scheduling Reports.