Monitoring accelerated connections
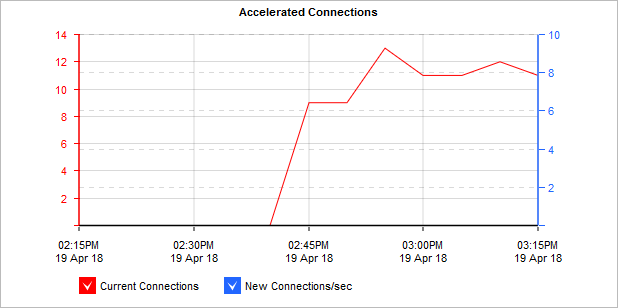
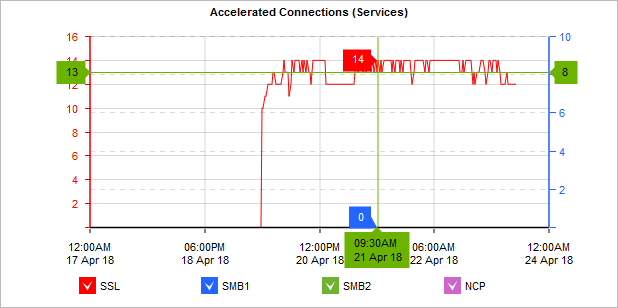
The Accelerated Connections report shows the number of concurrent accelerated connections as well as the connection establishment rate over time for the selected time period. It also shows the number of connections for each application acceleration type (SSL, SMB1, SMB2, NCP). This chart can answer questions such as:
- Is there an unusual number of accelerated connections or is the connection rate particularly high or low?
- Is my traffic being accelerated as I expect?
- Am I close to or have I exceeded my licensed maximum number of accelerated connections?”
NOTE
Connections over the licensed limit pass through the appliance without acceleration. If you are concerned about exceeding your licensed maximum, you can set an alert so that you will be emailed or so that the appliance will send an SNMPSimple Network Management Protocol trap when the number of connections exceed your licensed limit.
To find the report:
- On your browser, open the Exinda Web UI (
https://Exinda_IPInternet protocol_address). - Key-in the User and Password.
- Click Login.
- Go to Monitor > System > Accelerated Connections.

The Accelerated Connections graph displays accelerated connections over time.
The second chart shows accelerated connections for each type of accelerated traffic: SSL, SMB1, SMB2, and NCP.

The Accelerated Connections graph shows accelerated traffic by type over time.
Monitoring reports can be exported as a PDF document, saved as a scheduled report, or can be printed directly from the Web UI. For more information refer to Exporting, printing and scheduling reports.
Finding the licensed accelerated connections limit
To view the details of your license:
- Go to Configuration > System > Setup > License.
- The Max AA Connections field in the current system license status reports your licensed limit.
Setting an alert or sending an SNMP trap when the number of accelerated connections exceeds licensed limit
- Go to Configuration > System > Setup > Alerts.
- Ensure the appropriate check boxes are selected for Max Accelerated Connections Exceeded.
NOTE
The appliance must already be configured for email or SNMP.
Related Topics
Using interactive time graphs
- To understand how to get a better look at traffic patterns and to remove clutter on the time graph, see Using Interactive Time Graphs.
- To understand how to set the desired time range for a chart, see Setting the Time Range.
- To understand how to print the report or schedule the report, see Printing and Scheduling Reports.