Using interactive time graphs
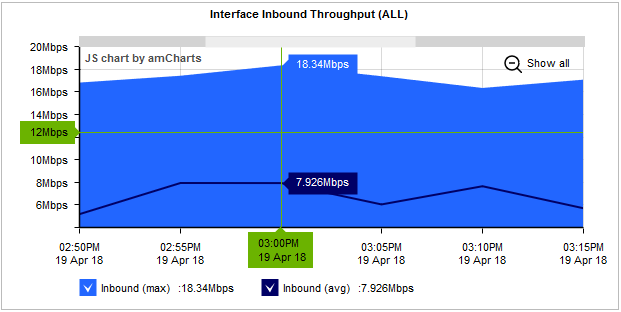
If you want a better look at a traffic pattern or if the chart is too cluttered, you can zoom in to a custom time range and remove time series lines that you are not interested in on the time graphs.
To zoom into a custom time range, click and drag your mouse on the chart to select the desired time range. To return to the initial time range click the 'Show all' magnifying glass icon. Any data displayed below these interactive graphs will automatically be updated with the data for the selected time range.
To remove a time series line, click on the check in the graph legend or in some cases the table below the chart to toggle off the display of that line.
NOTE
The interactive feature is only applicable to Flash generated graphs. To change the graph display option navigate to Configuration > System > Setup > Monitoring.