Email Performance Indicators report
The Email Performance Indicators report classifies users' productivity according to a set of predefined performance indicators, comparing user's email usage trends across a period of time. Results are relevant when the report is run on a group of people with the same job description since such people should have similar email usage trends.
Performance calculations are based on emails sent and received. Results are displayed according to the following indicators:
| Option | Description |
|---|---|
| Sociable | A friendly person, willing to talk and engage in activities with other people. |
| Takes Initiative | Has the ability to assess and initiate things independently. |
| Expressive |
A person able to effectively convey thoughts or feelings. |
| Organized | Systematic approach, likes order and can deal with assigned tasks efficiently. |
| Responsible | Carries out obligation to do something as part of a job or role. |
Specific emails can be excluded from the report, to eliminate irrelevant emails such as newsletters or automatic notifications.
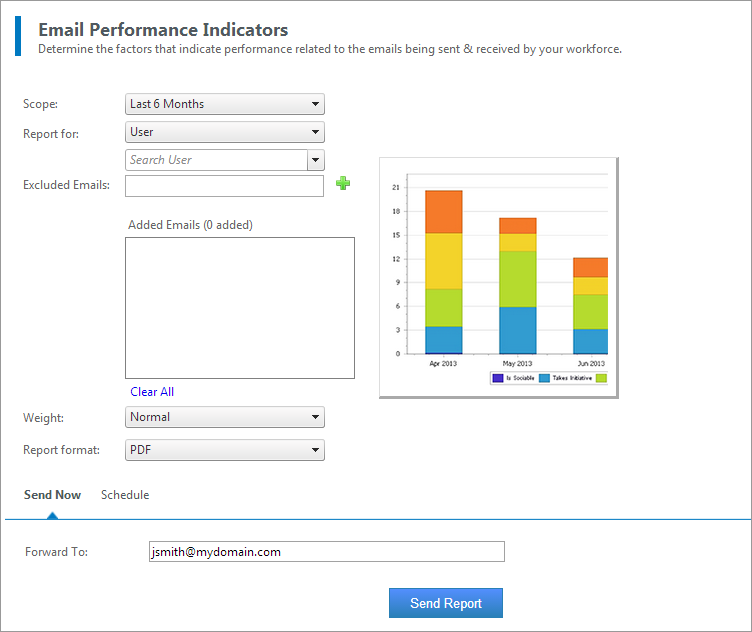
MailInsights® Email Performance Indicators report
Filter the report using the following criteria:
| Option | Description |
|---|---|
| Scope |
Specify date range or use default setting. Select from Last 6 Months or Last 12 Months. |
| Report for |
Select user or group. |
| Excluded Emails | Enter email addresses you want to exclude from the report. For example, you can exclude newsletters and automatic system notifications. For example *@newsletters.com. |
| Weight |
Weights represent user categories that typically define users within a specific role. For example, a salesperson is expected to send more emails than he receives, while an account manager receives more emails than he sends. Select from the following options:
|
| Report format | Select the type of output. Reports can be exported as an attachment in PDF or Excel (.xlsx) format. |
The generated report displays a bar chart with color coded data. Information for the selected mailbox (belonging to a user or group) is interpreted in two tables below the chart. The tables consist of the following information:
| Table | Description |
|---|---|
| Factors |
Lists a score for each performance indicator per month (or per user if the report is generated for a group). |
| Statistics Collected |
Email totals are listed either per user (if the report is generated for a group) or per month.
|
For further information, refer to: