Monitoring virtual circuits
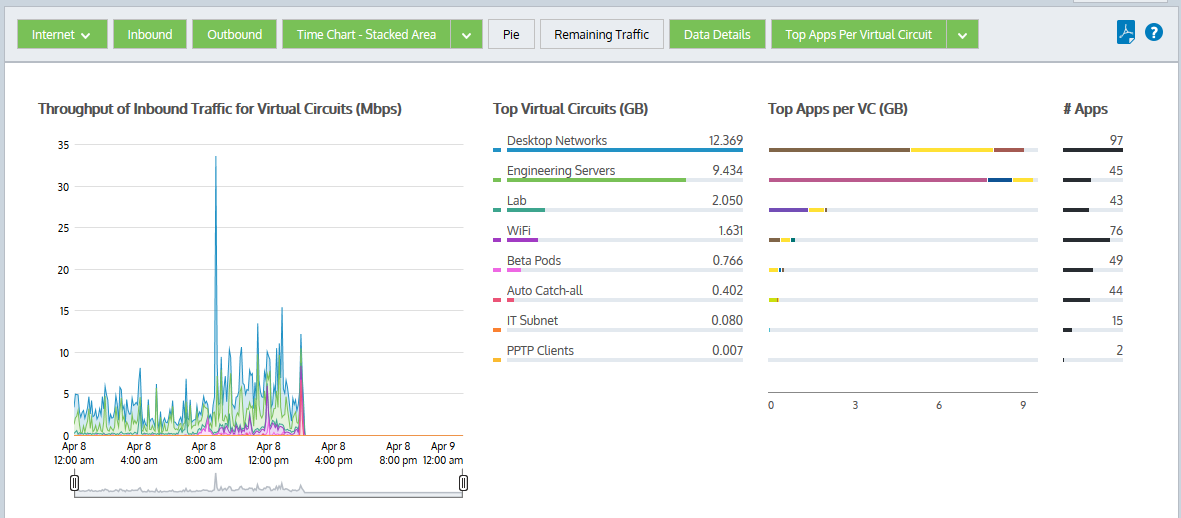
The Virtual Circuits report shows the top virtual circuits by volume and their average throughput. Virtual circuit traffic inbound into your LANLocal area network is reported separately from outbound traffic.
You can choose show the entire circuit traffic by adding in a category to represent the remaining virtual circuitlogical definitions that partition a a physical network circuit and used to determine what traffic passes through it and how much traffic on your network; the cumulative stack on the throughput chart represents all the virtual circuit traffic through the appliance. This will help you understand the significance of the top virtual circuits relative to the whole.
In addition to showing the data as a stacked cumulative display, you can choose to display the data as a line chart with a common zero baselineused by monitors and performance reports to establish a standard by which sunsequent performance can be measured. You can optionally show the top three applications for each of the top virtual circuits.
This report answers questions such as:
- What are the top virtual circuits in my network?
- How much bandwidth does my virtual circuit for the New York branch typically consume?
- I reserved 200 Kbps for this virtual circuit; is that amount of bandwidth really needed or is it to little?
- Do each of my branches (partitioned by virtual circuit) have the same top applications?
- What are the top apps per virtual circuit?
- What are the top internal and external hosts per virtual client?
Drill into the applications for a specific virtual circuit by clicking on the virtual circuit name in the charts or the tables below the charts. The applications graph will be shown filtered for the specified virtual circuit.
Vritual circuit details
NOTE
Average bandwidth is calculated as the total bits observed in the charting interval divided by the number of seconds in that interval. E.g. For a chart with an hour of data, the intervals are five minutes.
To access the report:
- On your browser, open the Exinda Web UI (
https://Exinda_IPInternet protocol_address). - Key-in the User and Password.
- Click Login.
- Go to Monitor > Virtual Circuits.
Monitoring reports can be exported as a PDF document, saved as a scheduled report, or can be printed directly from the Web UI. For more information refer to Exporting, printing and scheduling reports.
Various components on the screen can be toggled on and off by clicking buttons above the charts. Note that when generating a pdf report of this screen, the toggle states are taken into account. That is, if you had toggled off the outbound charts, they will not be present in the pdf.
- Circuit Type: When you first load the report, only Internet traffic (HTTP) is graphed by default.Click the Internet button to select Auto Catch-all to view all other traffic types graphed instead.
- Traffic Type (Inbound/Outbound): By default, both Inbound and Outbound traffic graphs are displayed. Click either the Inbound or Outbound option to hide the specific graph.
- Chart Type: The chart is initially mapped as a Stacked Area chart, but you can change the format to a Line chart if necessary.
- Pie: Toggles on or off a colour-coded Pie chart to the left of the Top Virtual Circuit chart.
- Remaining Traffic: Append or hide the Remaining Traffic data below the Top Virtual Circuit chart to represents the remaining traffic on your network and so the cumulative stack on the throughput chart represents all the virtual circuits communicating through the appliance.
- Data Details: Toggles on or off the data tables below the time series charts.
- Top Apps/Internal Hosts/External Hosts: Choose one of three display options to view the data per Virtual Circuit: Top Apps per Virtual Circuit (shown by default), Top Internal Hosts per Virtual Circuit, or Top External Hosts per Virtual Circuit.
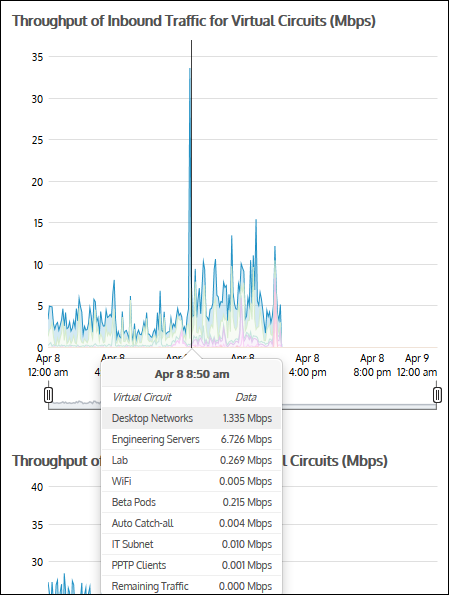
- Mouse Hover: Hover the mouse pointer over the graph to view data throughput at a given date and time.
View the throughput charts as a line chart with the remaining traffic category toggled off so that each virtual circuit has a common zero baseline. Compare the line for the virtual circuit relative to the bandwidth that was assigned to that virtual circuit.
Create a virtual circuit. See Virtual Circuits.
The number of virtual circuits shown are configurable. Note that this configuration applies to all charts on the appliance. For more information refer to Monitoring Configuration..
In general, yes. However, there are some cases where the traffic direction is different for subnets versus virtual circuits and so the totals will not match. For more information refer to Determining traffic direction and the implications of directional flow on reports.
- To understand how to set the desired time range for a chart, see Setting the Time Range.
- To understand how to the charts interact and what the toggle buttons do, see Understanding How Charts Relate.
- To understand how to drill into the data to find particular filtered data, see Drilling into the Data.
- To understand the difference between inbound and outbound traffic, see Understanding Traffic Direction.
- To understand how many data points are shown for each time period, see Understanding Traffic Granularity.
- To understand how to print the report or schedule the report, see Printing and Scheduling Reports.