Monitoring application response in real time
The Realtime Application Response monitor shows the slowest applications by round-trip-time observed by the Exinda Appliance during the last 10 seconds.
This report can answer questions such as:
- Which applications may be having problems?
- What are my poorest performing applications?
- Why is the application performing poorly; could it be due to network delay or server delay?
To access this report:
- On your browser, open the Exinda Web UI (
https://Exinda_IPInternet protocol_address). - Key-in the User and Password.
- Click Login.
- Go to Monitor > Real Time > Application Response.
Monitoring reports can be exported as a PDF document, saved as a scheduled report, or can be printed directly from the Web UI. For more information refer to Exporting, printing and scheduling reports.
The monitor shows application response metrics like round-trip time (RTT), normalized network delay, normalized server delay, normalized total delay, network delay, server delay, transaction delay, transaction count, and flowthe network traffic between network objects count by application. Traffic is sorted by round-trip-time.
You can set the chart to refresh frequently or infrequently or not at all. Each refresh shows 10 seconds of data.
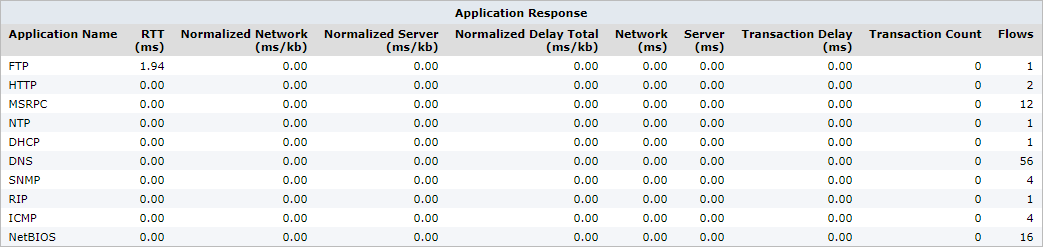
The Application Response monitor displays response by RTT.
NOTE
These statistics are only available if the Performance Metrics ASAM Module is enabled on the System > Setup > Monitoring page.
Related topic
Monitor the real time application response