Monitoring host health in real time
The Realtime Host Health monitor shows unhealthy hosts as measured by the number of retransmitted bytes during the last 10 seconds. This report answers questions such as:
- Which internal hosts are having the most difficulty with successfully transmitting traffic?
The monitor separates internal and external hosts and displays metrics like number of retransmitted bytes, number of aborted connections, number of refused connections, number of ignored connections, and the flowthe network traffic between network objects count for each internal and external host monitored during the last 10 seconds.
NOTE
A new internal mechanism was implemented in the ExOS 7.4.2 firmware that prevents Exinda Appliances from being affected by DDoS attacks. As a consequence, the “Ignored Connections” historical report is no longer available, but the Realtime Health report includes the number of ignored connections.
Traffic is sorted by the amount of retransmitted bytes. You can set the chart to refresh frequently or infrequently or not at all. Each refresh shows 10 seconds of data.
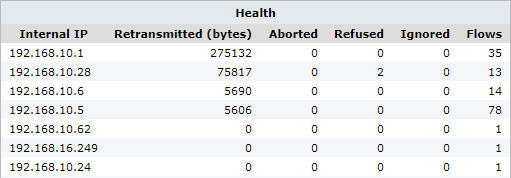
The Realtime Host Health report displays the number of retransmitted bytes.
NOTE
These statistics are only available if the Performance Metrics ASAM Module is enabled on the System > Setup > Monitoring page.
- On your browser, open the Exinda Web UI (
https://Exinda_IPInternet protocol_address). - Key-in the User and Password.
- Click Login.
- Click Monitor > Real Time>Host Health.
The reports contains the following status:
|
Connection Status |
Description |
|
Aborted Connections |
Connections that were unexpectedly aborted by either the client or server sending a TCPTransmission Control Protocol reset. |
|
Refused Connections |
Connections that were refused by the server (TCP SYN sent, received ICMPInternet Control Message Protocol refused or TCP reset in response). |
|
Ignored Connections |
Connections that were ignored by the server (TCP SYN sent, received nothing in response). |
- To change how often the table is refreshed, select an Auto-Refresh Rate from the list.
Monitoring reports can be exported as a PDF document, saved as a scheduled report, or can be printed directly from the Web UI. For more information refer to Exporting, printing and scheduling reports.
- On your browser, open the Exinda Web UI (
https://Exinda_IP_address). - Key-in the User and Password.
- Click Login.
- Click Configuration > System > Tools > Console.
- Type the appliance username and password at the prompts. Do one of the following:
- To enter privileged EXEC (enable) mode, at the prompt run the command:
hostname > enable
The hostname # prompt appears.
- To enter configuration (config) mode, at the prompt run the commands:
hostname # configure terminal
The hostname (config)# prompt appears.
- To display realtime TCP health from the CLICommnad line interface, use the following command:
(config) # show realtime apm hosts
The following results are displayed:
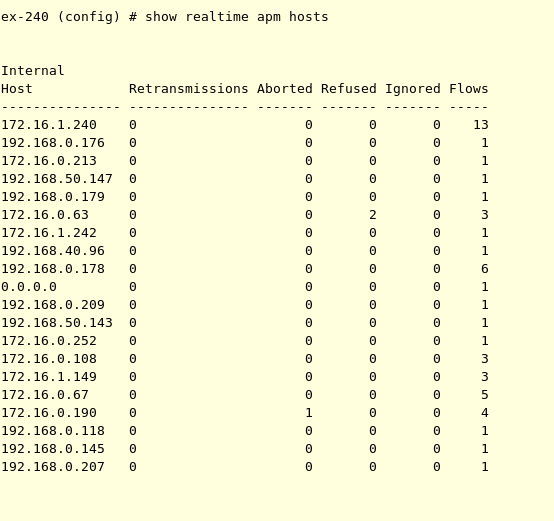
Realtime TCP health from the CLI