Monitoring conversations in real time
The Realtime Conversations monitor shows the top conversations by throughput observed by the Exinda Appliance during the last 10 seconds. This report answers questions such as:
- My link is congested; who's doing what on my network right now?
- I think I have a problem with a particular host or subnet; what is that host or subnet doing right now?
- Is network traffic being accelerated or processed by Edge Cache properly?
- Is network traffic passing through my High Availability or Cluster correctly?"
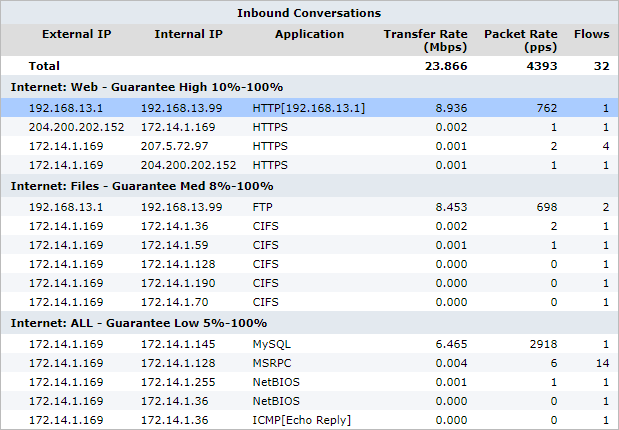
Inbound and outbound conversation traffic is displayed separately. Conversations are represented by external IPInternet protocol address, internal IP address, and application. Some traffic types show extra information (like URL) in square brackets following the application.
Traffic is sorted by transfer rate. The packet rate and number of flows for each conversation in the preceding 10 second period is shown. You can set the chart to refresh frequently or infrequently or not at all. Each refresh shows 10 seconds of data.
The Realtime Conversations monitor helps you diagnose issues by:
- Filtering the conversations by IP address or subnet
- Showing the user name associated with the internal IP address
- Showing which policy the conversation falls into
- Allowing connections within a flowthe network traffic between network objects to either be shown individually or to be grouped together
- Highlighting accelerated conversations in yellow and indicating the acceleration technique used
- Highlighting conversations processed by Edge Cache (in blue)
- Indicating how the conversations is flowing through the high availability cluster
- Indicating asymmetric traffic
The Conversation monitor report displays information about network traffic.
- On your browser, open the Exinda Web UI (
https://Exinda_IP_address). - Key-in the User and Password.
- Click Login.
- Go to Monitor > Real Time > Conversations.
Monitoring reports can be exported as a PDF document, saved as a scheduled report, or can be printed directly from the Web UI. For more information refer to Exporting, printing and scheduling reports.
Accelerated conversations are highlighted in yellow and the application acceleration technologies applied to that conversation are displayed on the left-hand side as a series on icons.
For example, the FTP connection below is accelerated and processed by WANWide Area Network Memory, indicated by the icon.

Conversations processed by Edge Cache (see the Edge Cache "How-to" Guide), are highlighted in blue.

The following legend describes the meaning of each acceleration icon.

|
WAN Memory: The connection is been processed by WAN Memory. |

|
CIFS Acceleration: The connection is been processed by CIFS Acceleration. |

|
SSL Acceleration: The connection is been processed by SSL Acceleration. |

|
NCP Acceleration: The connection is been processed by NCP Acceleration. |

|
MAPI Acceleration: The connection is been processed by MAPI Acceleration. |
When an appliance is deployed in a High Availability (HA) or Clustering mode, the following icons may appear next to conversations.
|
|
Asymmetric: The traffic is asymmetric, and is not being accelerated. |

|
Locally Bridged: The connection is passing through this appliance in the cluster. If the row is colored yellow, then the flow is remotely accelerated. |

|
Remotely Bridged: The connection is passing through another appliance in the cluster. If the row is colored yellow, then the flow is remotely accelerated. |

|
Locally/Remotely Bridged: The connection is passing though both this and other appliances in the cluster. (Asymmetric traffic) If the row is colored yellow, then the flow is remotely accelerated. |

|
Locally Bridged + Locally Accelerated: The connection is passing through this appliance in the cluster and is being accelerated on this appliance. |

|
Remotely Bridged + Locally Accelerated: The connection is passing through another appliance in the cluster and is being accelerated on this appliance. |

|
Locally/Remotely Bridged + Locally Accelerated: The connection is passing through both this and other appliances in the cluster and is being accelerated on this appliance. (Asymmetric traffic) |
Type the IP address or subnet in the IP/Subnet Filter field at the top of the screen and click Apply. Conversations can be filtered by IPv4 or IPv6 addresses.
Check the Show Users checkbox.
NOTE
You must have Active Directory configured to display user names. See For more information refer to Integrate with Active Directory..
Toggle on or off the Group checkbox at the top of the screen.
Select Show Policies checkbox at the top of the screen.
If you are unsure whether traffic is being processed properly by the virtual circuitlogical definitions that partition a a physical network circuit and used to determine what traffic passes through it and how much or the policies within your virtual circuit, use real time monitoring to determine if traffic is hitting the virtual circuit as you expect.
- On the Real Time Conversations screen.
- Select Show Policies checkbox at the top of the screen to group the conversations by virtual circuit and policy.
- Look at the traffic falling under your virtual circuit to decide if the correct traffic is in there.
- If traffic that you expected is not there, look in other virtual circuit groups to find the traffic.
- If traffic is falling into the wrong virtual circuit, check the definition of the affected virtual circuits and ensure the most specific virtual circuit is higher in the policy tree.