Monitoring network applications in real time
The Applications in Real Time monitor shows the top applications by throughput observed during the last 10 seconds. This report answers questions such as:
- My link is congested; which applications are on my network right now?
- How much bandwidth is BitTorrent using right now?
The Applications in Real Time monitor shows inbound application traffic separately from outbound application traffic. Traffic is sorted by transfer rate. The packet rate and a number of flows for each application in that 10 second period are also shown. The Distribution percentage shows the proportion of bandwidth consumption of each application relative to all applications.
You can set the chart to refresh frequently or infrequently or not at all. Each refresh shows 10 seconds of data.
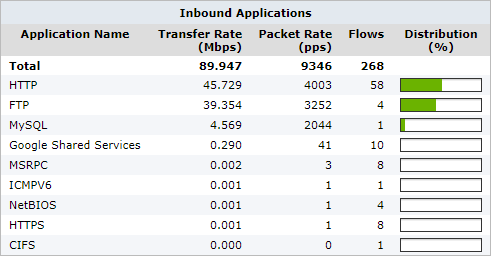
The Inbound Applications monitor
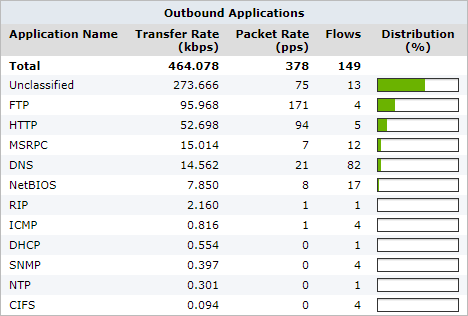
The Outbound Applications monitor
To find this report:
- On your browser, open the Exinda Web UI (
https://Exinda_IPInternet protocol_address). - Key-in the User and Password.
- Click Login.
- Go to Monitor > Real Time > Applications.
Monitoring reports can be exported as a PDF document, saved as a scheduled report, or can be printed directly from the Web UI. For more information refer to Exporting, printing and scheduling reports.