Monitoring reductions in real time
The Realtime Reductions monitor shows reductionmeasures the amount of redundant data that has been removed from the network, increasing capacity by application during the last 5 minutes. This report answers questions such as:
- Am I getting the reduction, freeing the network capacity I expect?
The monitor filter shows inbound application traffic, outbound application traffic, or bi-directional traffic.
The amount of data on the LANLocal area network-side and WANWide Area Network-side of the appliance is shown along with the reduction ratio during the previous 5 minute sliding window.
You can set the chart to refresh frequently, infrequently, or not at all. Each refresh shows 5 minutes of data ending on the most recent 10 second boundary. That is, if it refreshes at 9:38:17, the chart will show data from 9:33:10 - 9:38:10.
NOTE
This report is only shown when there are two or more Exinda Appliances.
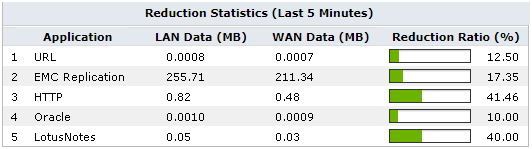
The reduction statistics report.
To access this report:
- On your browser, open the Exinda Web UI (
https://Exinda_IPInternet protocol_address). - Key-in the User and Password.
- Click Login.
- Go to Monitor > Real Time > Reduction.
Monitoring reports can be exported as a PDF document, saved as a scheduled report, or can be printed directly from the Web UI. For more information refer to Exporting, printing and scheduling reports.
The reduction ratio calculation:
Reduction Ratio = (Data Transfer Size Before Exinda - Data Transfer Size After Exinda) / Data Transfer Size Before Exinda
Reduction Ratio = LAN Data - WAN Data / LAN Data