Monitoring TCP efficiency
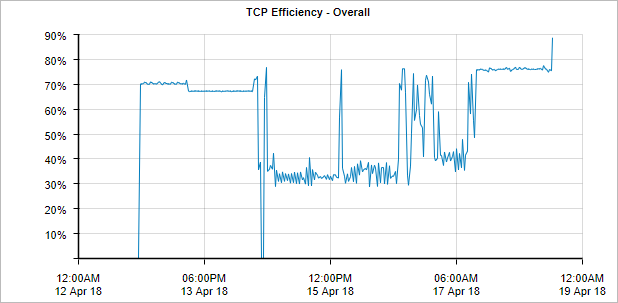
The TCPTransmission Control Protocol Efficiency report shows the total efficiency of all TCP connections over time. The report data can be categorized by applications, internal hosts or external hosts. You can drill into particular apps or hosts to view the efficiency for particular traffic.
This report answers questions such as:
- Are we experiencing network delays due to TCP inefficiencies?
- Is a particular application or host having troubles due to retransmissions?

The TCP Efficiency report displays TCP connection efficiency over time.
TCP Efficiency is calculated using the formula below:
TCP Efficiency = (Total Bytes - Bytes Retransmitted) / Total Bytes
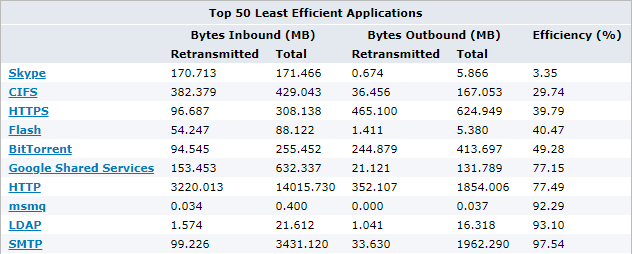
The table below shows both retransmitted bytes and efficiency per Application or Host. Each item in the table below can be drilled down to view TCP Efficiency details and a graph for that item.

The TCP Efficiency report displays the 50 least efficient applications.
To access this report:
- On your browser, open the Exinda Web UI (
https://Exinda_IPInternet protocol_address). - Key-in the User and Password.
- Click Login.
- Go to Monitor > Service Levels > TCP Efficiency.
Monitoring reports can be exported as a PDF document, saved as a scheduled report, or can be printed directly from the Web UI. For more information refer to Exporting, printing and scheduling reports.
- To understand how to get a better look at traffic patterns and to remove clutter on the time graph, see Using Interactive Time Graphs.
- To understand how to set the desired time range for a chart, see Setting the Time Range.
- To understand how to print the report or schedule the report, see Printing and Scheduling Reports.