Monitoring network response SLA
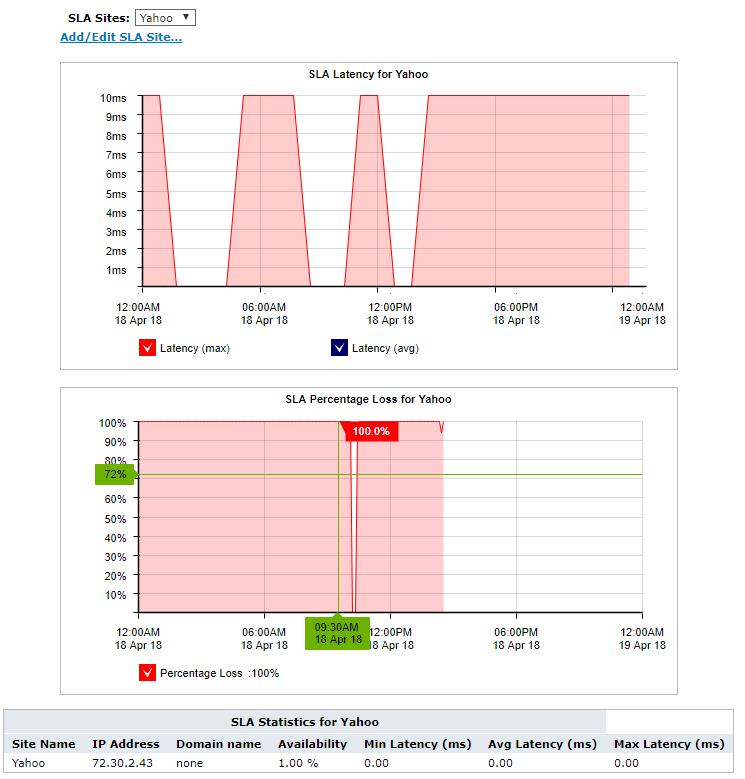
The SLA monitor reports the performance of your ISPIntenet service provider against a set of predefined criteria. The SLA monitor sends 1 64-bit long ICMPInternet Control Message Protocol ping every 10 seconds to the remote site. It reports the maximum and average latency and the percentage loss of the pings over time. This report answers questions such as:
- Is my ISP always available?
- What is the latency of my ISP?

The SLA monitor tracks latency and percentage loss over time.
For each SLA object, the Exinda tracks the IPInternet protocol address, percentage of availability, minimum and maximum and average latency in the table below the charts.
- Availability is the percentage of time a resource is reachable by the Exinda appliance.
- Latency is the delay in getting an ICMP echo reply for an ICMP echo request generated from the Exinda appliance. It represents both the delay from the local Exinda appliance to a remote host and back again.

To access this report:
- On your browser, open the Exinda Web UI (
https://Exinda_IP_address). - Key-in the User and Password.
- Click Login.
- Go to Monitor > Service Levels > Network Response (SLA).
Monitoring reports can be exported as a PDF document, saved as a scheduled report, or can be printed directly from the Web UI. For more information refer to Exporting, printing and scheduling reports.
Click the Add/Edit SLA Site... link. See TO-DO for details of configuring an SLA object.
Select the desired site from the SLA Sites selector.
- To understand how to get a better look at traffic patterns and to remove clutter on the time graph, see Using Interactive Time Graphs.
- To understand how to set the desired time range for a chart, see Setting the Time Range.
- To understand how to print the report or schedule the report, see Printing and Scheduling Reports.