Monitoring prioritization of applications
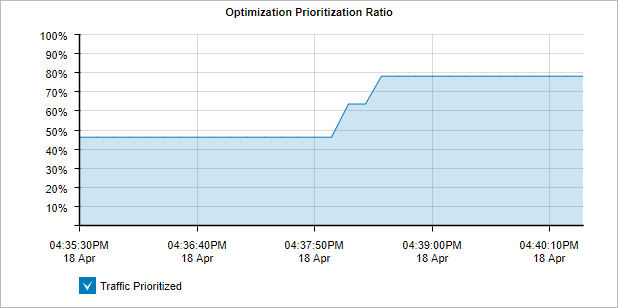
The Prioritization report shows how often applications were prioritized (also referred to as re-ordering or re-queuing).
This report answers questions such as:
- I've created a number of policies with different priorities; how much of my traffic is re-ordered to ensure that my important traffic has priority on my network?
A high percentage means that the system is prioritizing more often to ensure performance of your applications. A high percentage also means that by turning off the optimizer there is a higher probability critical applications will suffer.

EXAMPLE
A ratio of 40% means 40% of the packets on your network were re-ordered. That means that non critical data was queued so business critical data could jump the queue and be delivered according to business requirements.
To access the report:
- On your browser, open the Exinda Web UI (
https://Exinda_IPInternet protocol_address). - Key-in the User and Password.
- Click Login.
- Go to Monitor > Control > Prioritization Ratio.
Monitoring reports can be exported as a PDF document, saved as a scheduled report, or can be printed directly from the Web UI. For more information refer to Exporting, printing and scheduling reports.
Prioritization Ratio = 100 x Number of Packets Re-ordered / Number of Total Packets
- To understand how to get a better look at traffic patterns and to remove clutter on the time graph, see Using Interactive Time Graphs.
- To understand how to set the desired time range for a chart, see Setting the Time Range.
- To understand how to print the report or schedule the report, see Printing and Scheduling Reports.