Monitoring discarded network packets
The Discard report shows the number of discarded packets over time for the specified span of time as a result of Optimizer policies configured to block traffic.
This report answers questions such as:
- How many attempts to access blocked apps occurred?
- When are people trying to access the blocked apps?
The graph shows the number of packets discarded over time. The table below the graph shows the total number of discarded packets over the selected time period.
Select a virtual circuitlogical definitions that partition a a physical network circuit and used to determine what traffic passes through it and how much from the Virtual Circuit selector at the top of the graph to view the packet discards for it. Filter by policy by selecting a policy in the Policy selector. Only virtual circuits and policies that have reported packet discards will appear in the selectors at the point in time where the packets were discarded, which gives an indication where more traffic would have appeared on the network if that traffic had not been blocked.

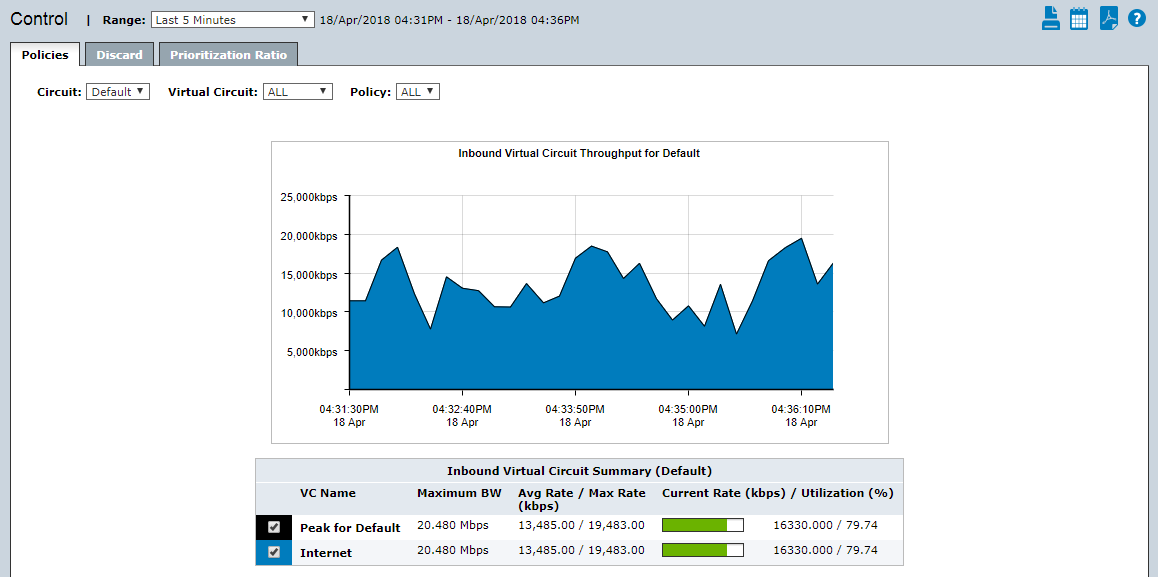
The Discard tab on the Control report discard packets over time.
To access the report:
- On your browser, open the Exinda Web UI (
https://Exinda_IPInternet protocol_address). - Key-in the User and Password.
- Click Login.
- Go to Monitor > Control > Discard.
Monitoring reports can be exported as a PDF document, saved as a scheduled report, or can be printed directly from the Web UI. For more information refer to Exporting, printing and scheduling reports.
- To understand how to get a better look at traffic patterns and to remove clutter on the time graph, see Using Interactive Time Graphs.
- To understand how to set the desired time range for a chart, see Setting the Time Range.
- To understand how to print the report or schedule the report, see Printing and Scheduling Reports.