Monitoring the effects of policy controls
The Policies report shows the average throughput and the peak throughput for a circuit, a virtual circuitlogical definitions that partition a a physical network circuit and used to determine what traffic passes through it and how much, or a policy over time. However, only the traffic that fell into a bandwidth shaping (control) policy is reported. The traffic inbound to your LANLocal area network is shown separately from the outbound traffic.
If your virtual circuit was defined to provide fair sharing among hosts, the Dynamic Virtual Circuit cart will show the number of active hosts and the number of hosts that exceeded the limit and therefore were not processed by the virtual circuit.
This report answers questions such as:
- Are my control policies having the effect I need them to?
- How much traffic is being controlled?
- Are my policies actively limiting the traffic?
- How much traffic is hitting my ‘Choke P2P’ policy?
- Are hosts being excluded from the dynamic virtual circuit?
NOTE
The Policies report only shows traffic for control and bandwidth shaping policies. Accelerated traffic is not included in this report.
VERSION INFO
Showing the peak throughput is available in version 7.0.1 Update 1 and later.
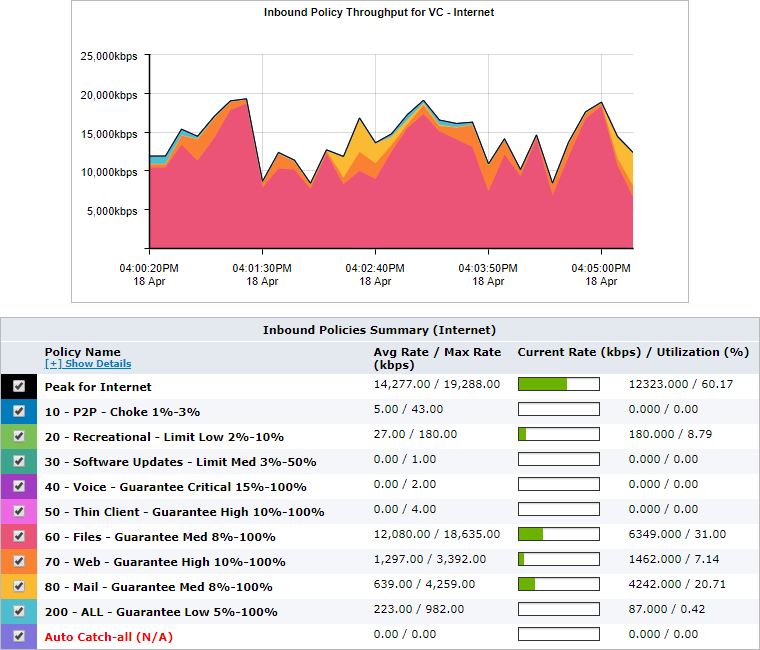
When showing the circuit, the average throughput of the underlying virtual circuits are shown in a stacked graph. The peak throughput for the circuit is shown as a line. Any of the virtual circuits or the peak throughput for the circuit can be removed from the chart by clearing the checkbox in the table below the graph.
The table beneath the graph shows some additional information for the selected time period.
- Maximum Bandwidth is the amount of bandwidth specified in the virtual circuit. The maximum, average, and current rates are measured as per-second throughput.
- Average Rate is the average throughput for the time specified in the time range, that is the total volume of data divided by the number of seconds in the specified time period.
- Max Rate is the maximum throughput or peak bandwidth.
NOTE
Each time period is broken into 10 second intervals. The throughput for each 10 second sample is the total volume of data seen in that sample divided by 10 seconds to yield a per-second throughput rate. Max Rate is the maximum 10-second throughput. Current Rate is the throughput averaged over the last 10 seconds. Utilization is the percentage when you consider the current rate as compared to the maximum bandwidth.
Control graph for a specified circuit
When showing a particular virtual circuit, the average throughput of the underlying top policies are shown in a stacked graph. The peak throughput for the virtual circuit is shown as a line.
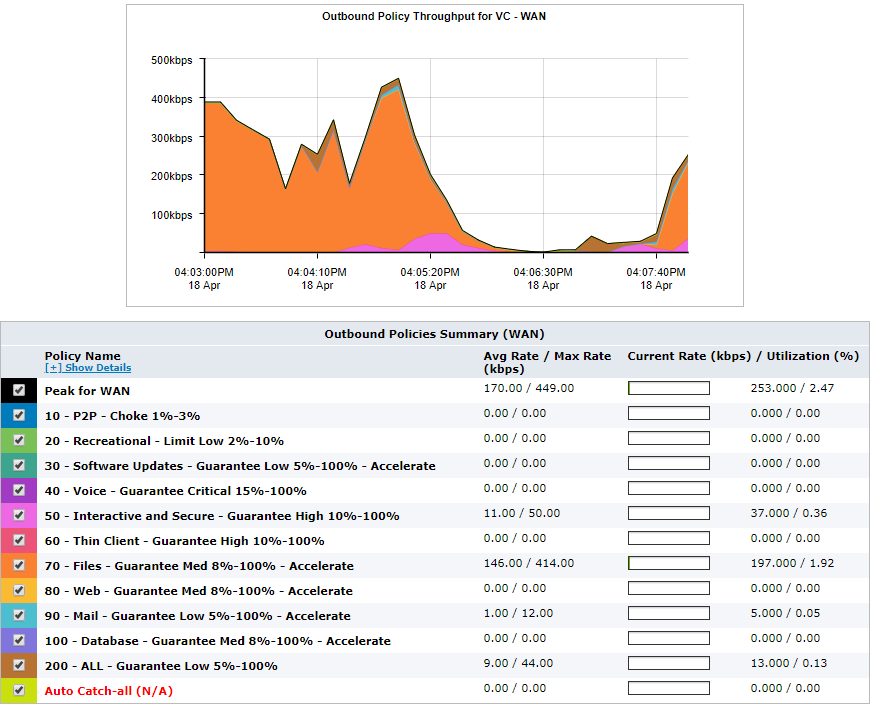
Control graph for a specified virtual circuit
When showing a particular policy, the average throughput for the selected policy is shown in the throughput chart. The peak throughput for the virtual circuit is shown as a line.
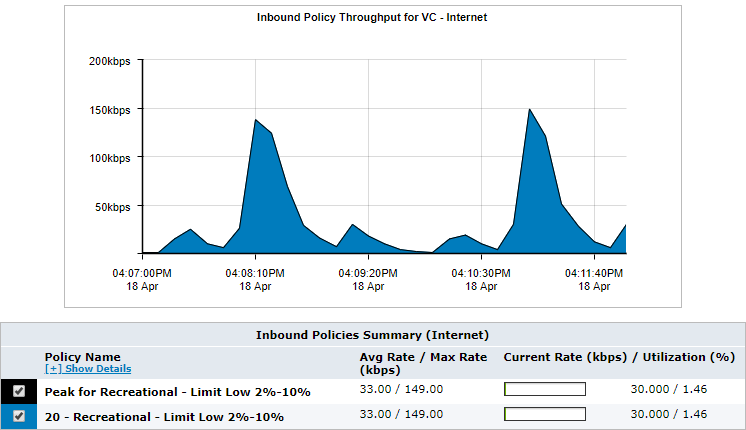
Control graph for a specified policy
Virtual circuits can be defined to provide fair share per host shaping for each host that falls into the virtual circuit. This dynamic virtual circuit dynamically divides the amount of bandwidth available for the number of active hosts. The policies page will show the number of active hosts and the number of hosts that have exceeded the hosts limit for a selected dynamic virtual circuit. The hosts that exceeded the hosts limit were not handled by this virtual circuit and would have been captured in another virtual circuit.
If the virtual circuit selected is a dynamic virtual circuit, then the following graph will appear above the throughput graph.
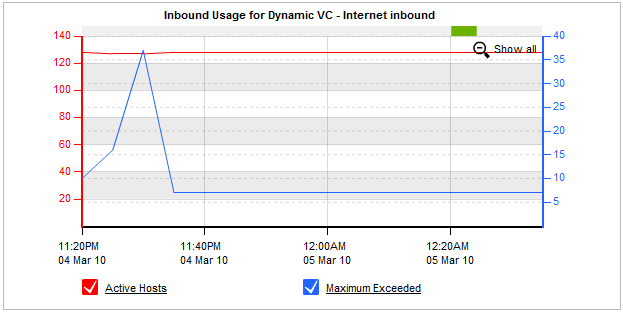
Control graph for a dynamic virtual circuit showing the number of hosts included (Active Hosts) and excluded (Maximum Exceeded) from the virtual circuit
The 'Active Hosts' line shows the number of hosts that were processed by this dynamic virtual circuit over time. The 'Maximum Exceeded' line shows the number of hosts that have exceeded the hosts limit for this dynamic virtual circuit.
To access the report:
- On your browser, open the Exinda Web UI (
https://Exinda_IPInternet protocol_address). - Key-in the User and Password.
- Click Login.
- Go to Monitor > Control > Policies.
Monitoring reports can be exported as a PDF document, saved as a scheduled report, or can be printed directly from the Web UI. For more information refer to Exporting, printing and scheduling reports.
Select the desired circuit. Set the desired virtual circuit to ALL. The average throughput for the circuit is shown in the throughput chart.
Select the desired circuit. Set the desired virtual circuit. The average throughput for the top policies is shown stacked in the throughput chart.
Select the desired circuit. Select the desired virtual circuit. Select the desired policy. The average throughput for the selected policy is shown.
The average bandwidth is calculated as the total bits observed in the charting interval and dividing by the number of seconds in that interval. E.g. For a chart with an hour of data, the intervals are five minutes. Thus, for each five-minute interval, the number of observed bits is divided by 300 seconds.
The peak bandwidth is calculated as the maximum throughput observed in the charting interval, where the considered throughput is the average over a 10 second interval. E.g. For a chart with an hour of data, the intervals are five minutes. For a five minute interval, there are 30 possible 10-second intervals considered. The average bits per second are calculated for each 10-second interval. The maximum of these 30 possible calculations is considered the peak throughput for that five-minute interval.
Select the desired circuit, the desired virtual circuit, and the desired policy. The average throughput for the selected policy is shown in the throughput chart. If the throughput chart has any raised flat tops, this may represent that the policy is actively limiting the traffic.
- To understand how to get a better look at traffic patterns and to remove clutter on the time graph, see Using Interactive Time Graphs.
- To understand how to set the desired time range for a chart, see Setting the Time Range.
- To understand how to print the report or schedule the report, see Printing and Scheduling Reports.