Zooming into a time Interval on the time graphs
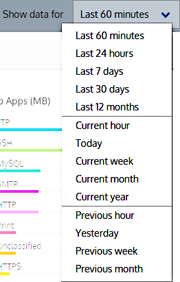
To view data within a time range, you can use the Show data for drop-down list to narrow the range. If does not provide the detail you need, you can narrow the search further by clicking and dragging within the graph or by using the zoom control below the graph. These methods allow you to define a custom time range.

The "Show data for" drop-down list
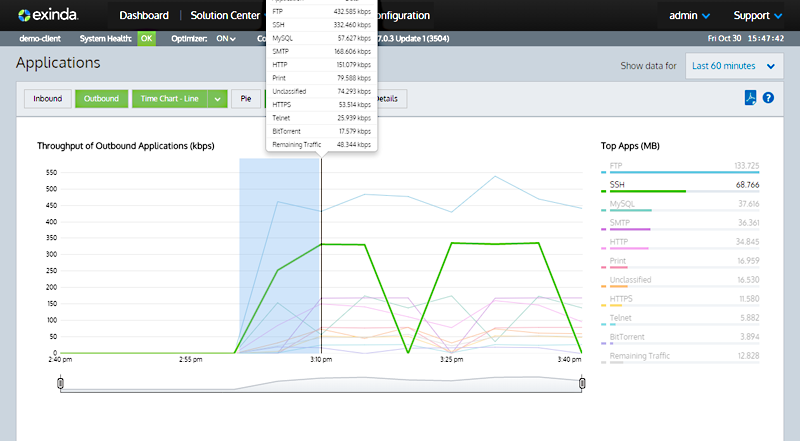
Click and drag your mouse on the chart to select the desired time range.
Drag the handles on the zoom controller to modify the time range. As you drag, the area between the drag points becomes shaded. When you release, the shaded area expands to occupy the entire graph. To return to the initial time range, click on the Zoom Out  button to the left of the zoom controller.

You can also use the zoom controls that appear below the graph. Drag the handles in from the left and/or the right to isolate the data you need. The graph is dynamic, so you can immediately view the data. The handles remain in the positions you left them, so the scope of the initial report remains evident.. When finished click on the Zoom Out  button.

The Zoom controls