Configuring an application performance metric object
The Application Performance Metric (APM) objects are used to monitor particular application performance metrics. By creating an APM object, you indicate which application to monitor. Optionally, you can also specify a network objecta logical definition created and stored in the Exinda lilbrary, can represent any network component so that the application is only monitored when observed on that part of the network. You set a threshold on a single network metric. Later, traffic for that application is assessed against that threshold to determine how well the application is performing. An alert is triggered when the threshold is exceeded for a given length of time.
The following metrics are available:
- bytes lost
- network delay
- server delay
- transaction delay
- normalized network delay
- normalized server delay
- normalized transaction delay
- round trip time
- tcp connections aborted
- tcp connections ignored
- tcp connections refused
- tcp connected started.
Adding a new APM object.
NOTE
APM values are not shown on any report; they are used solely to generate alerts.
Use the following instructions to create an APM object.
Before you begin…
- If you need to enable alerts, ensure that you have set Email on the Configuration > System > Setup > Alerts page. For more information, see the Exinda Web UI help.
- You also need to set up SNMPSimple Network Management Protocol on the Configuration > System > Network > SNMP page. for more information, see the Exinda Web UI help.
To create an APM object
- Go to Configuration > Objects > Service Levels > Application Performance Metric.
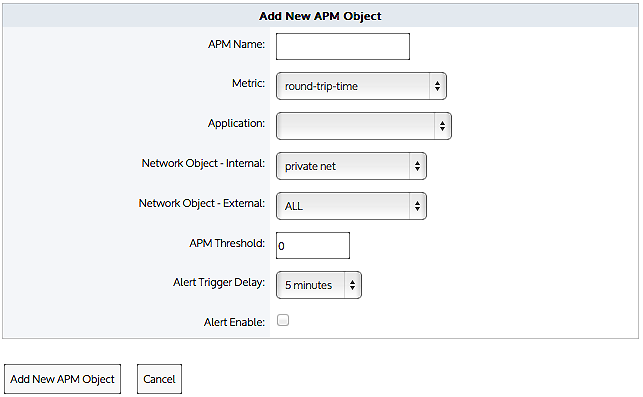
- Click the Add New APM Object button.
- Type a name for the APM object.
- Select the metric that you need to monitor. The following metrics are available:
- bytes-lost — Bytes lost due to retransmissions.
- network-delay — The time taken for data to traverse the network.
- server-delay — The time taken for a server to respond to a request.
- transaction-delay — The total time for a transaction (network delay + server delay)
- normalized-network-delay — The time taken for data to traverse the network where the packet size is normalized to 1024 bytes.
- normalized-server-delay — The normalized measure of the time taken for a server to respond to a transaction request.
- normalized-transaction-delay — The normalized measure of the time taken for a client request to be sent to a server, and the server's reply to be received by the client.
- round-trip-time — The time taken for a packet to travel from a device, cross a network, and return.
- tcp-connections-aborted — The number TCPTransmission Control Protocol connections reset after the connection is established. (RST from client or server)
- tcp-connections-ignored — The number TCP connections that expire in the SYN-SENT state. No response is received from the server.
- tcp-connections- refused — The number TCP connections that are reset before the connection is established. (RST in SYN-SENT state)
- tcp-connections-started — The number of TCP connections initiated.
- In the Application list, select the application traffic to monitor.
- If you want to just monitor the application for a particular internal network object, specify the desired internal network object; otherwise select ALL.
- If you want to just monitor the application for a particular external network object, specify the desired external network object; otherwise select ALL. By specifying both the internal and external network object, only the application conversations between the specified network objects will be tracked.
- Select the Alert Enable checkbox.
- In the APM Threshold field, type the threshold that will trigger an alert if the score drops below that value.
- In the Alert Trigger Delay list, select how long the metric needs to remain below the threshold before the alert is sent. For example, if the alert is tracking the number of bytes lost, the threshold is set to 100, and the alert trigger delay is set to 5 minutes, then the number of bytes lost needs to be above 100 for 5 minutes before the alert is triggered.
- Set the threshold for the APM metric. The units of the threshold is relative to the metric being measured. That is, delays and round trip time are measured in milliseconds, tcp connections and bytes lost are counts.
- Click Add New APM Object. The object is added to the list of configured APM objects.