Monitoring edge cache reduction
The Edge Cache report shows the reductionmeasures the amount of redundant data that has been removed from the network, increasing capacity in the amount of traffic achieved due to caching techniques and the number of requests and the number of hits from the cache.
This report answers questions such as:
- How much traffic reduction am I getting due to Edge Cache?
- How cacheable is the network data and how frequently is the cache being accessed?
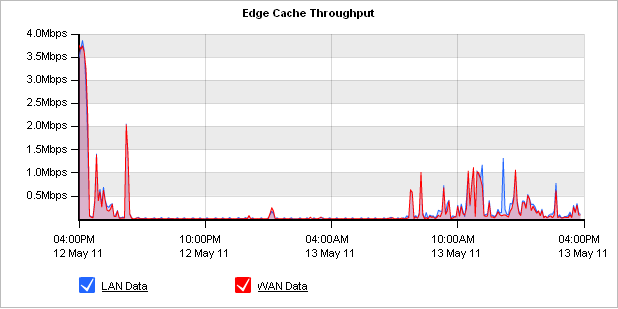
The chart shows the traffic reduction over time as either throughput or percentage reduction. The reported LANLocal area network throughput is the amount of traffic that was served to the client whether it was served from Edge Cache or not. This represents all traffic that was handled by Edge Cache policies. The reported WANWide Area Network throughput is the amount of traffic that was not available in Edge Cache and needed to be retrieved from the application server. Therefore, the difference between WAN and LAN is the amount of traffic that could be served from Edge Cache.
When reduction statistics are displayed as throughput, there is one time series plotted for LAN throughput and one for WAN throughput. You should expect the LAN throughput to be higher than WAN throughput. When the LAN throughput is greater than the WAN throughput, the more traffic was served up from Edge Cache than was needed to be retrieved from the WAN.

The Edge Cache Throughput graph.
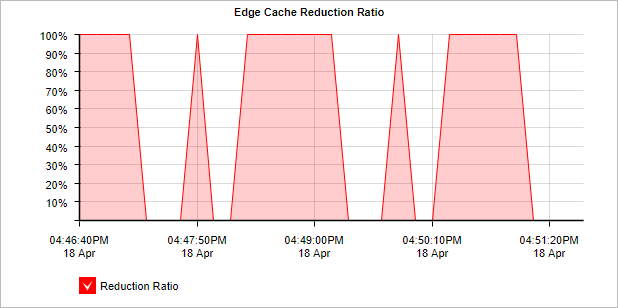
When displayed as percentage reduction, it displays one line graph to represent the percentage of data transferred that was sent from Edge Cache instead of from the application server.

The Edge Cache Reduction Ration graph.
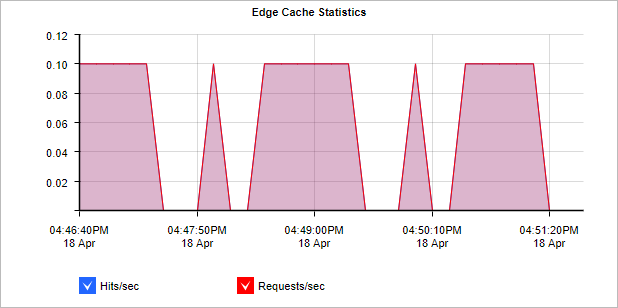
The Edge Cache Statistics chart display the number of requests per second and the number of hits per second. A request occurs when Edge Cache is checked for particular data. A hit occurs when a request is satisfied by an object already stored in the Edge Cache.

The Edge Cache Statistics graph.
The table shows a summary of Edge Cache reduction for the selected time period.

- On your browser, open the Exinda Web UI (
https://Exinda_IPInternet protocol_address). - Key-in the User and Password.
- Click Login.
- Go to Monitor > Optimization > Edge Cache.
Monitoring reports can be exported as a PDF document, saved as a scheduled report, or can be printed directly from the Web UI. For more information refer to Exporting, printing and scheduling reports.
Select the desired type of chart from the Edge Cache Graph Type selector below the chart.
Reduction Ratio = (Data Transfer Size Before Exinda - Data Transfer Size After Exinda) / Data Transfer Size Before Exinda
- To understand how to get a better look at traffic patterns and to remove clutter on the time graph, see Using Interactive Time Graphs.
- To understand how to set the desired time range for a chart, see Setting the Time Range.
- To understand how to print the report or schedule the report, see Printing and Scheduling Reports.