Overview
DashboardA graphical representation that indicates the status of various operations that might be currently active, or that are scheduled. Overview
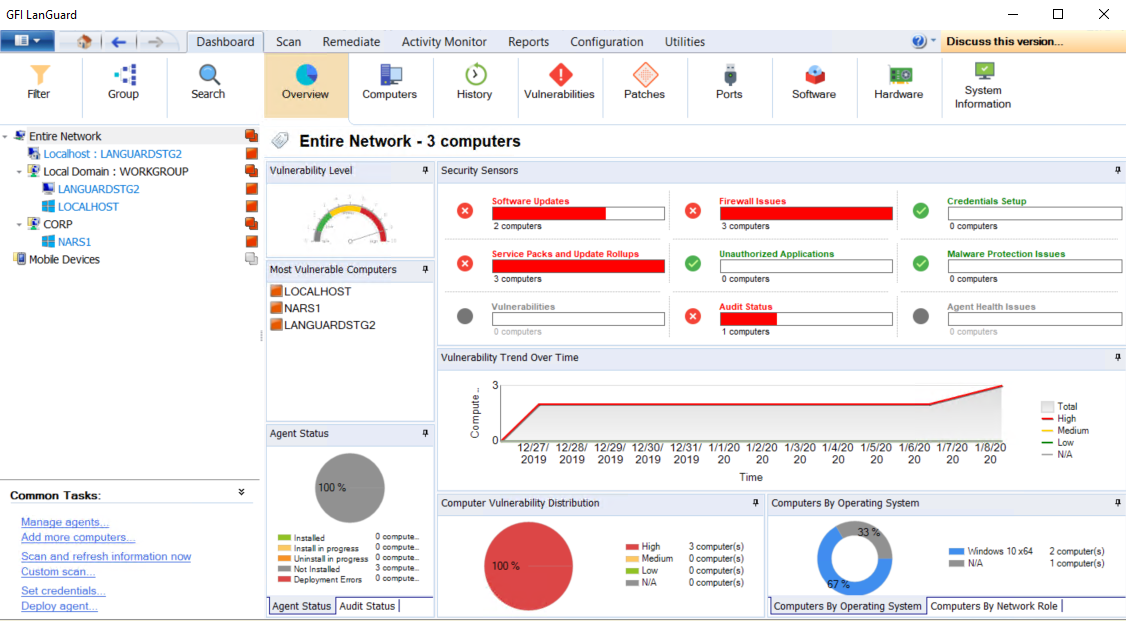
The Dashboard Overview is a graphical representation of the security level/vulnerability level of a single computer, domain or entire network.
When a computer or domain is selected, the results related to the selected computer/domain are automatically updated in the dashboard. Below is a description of each section found in the dashboard:
| Section | Description |
|---|---|
| Network security level | This rating indicates the vulnerability level of a computer/network, depending on the number and type of vulnerabilities and/or missing patches found. A high vulnerability level is a result of vulnerabilities and/or missing patches which average severity is categorized as high. |
| Computer vulnerability distribution | This chart is available only when selecting a domain or a workgroup, and displays the distribution of vulnerabilities on your network. This chart enables you to determine how many computers have high, medium and low vulnerability rating. |
| Most vulnerable computers | This list is available only when selecting a domain or a workgroup, and shows the most vulnerable computers discovered during the scan. The icon color on the left indicates the vulnerability level. |
| Agent Status |
When selecting a domain or workgroup, a chart showing the overall agent status of all computers within the domain/workgroup is displayed. This enables you to determine the number of agents installed or pending installation on the selected domain/workgroup. When selecting a single computer, this section displays an icon representing the agent status. The icons are described below:
|
| Audit status | This chart is available only when selecting a domain or workgroup and enables you to identify how many audits have been performed on your network grouped by time. |
| Vulnerability trends over time | When a domain or workgroup is selected, this section displays a line graph showing the change of vulnerability level over time grouped by computer count. When a single computer is selected, this section displays a graph showing the change of vulnerability level over time for the selected computer. |
| Computers by network role | This chart is available only when selecting a domain or a workgroup and displays the number of audited computers, grouped by network role. Amongst other roles, this graph identifies the number of servers and workstations per selected domain. |
| Computers by operating system | This chart is available only when selecting a domain or a workgroup and displays the number of audited computers, grouped by the installed operating system. |
| Computer details | This section is available when selecting a single computer and enables you to view the selected computer details. |
| Scan activity | This line graph is available only when selecting a single computer and enables you to view the number of scans/audits performed on the selected computer. In addition enables you to verify if scheduled scans are being performed. |
| Remediation Activity | This line graph is available only when selecting a single computer and enables you to view the number of remediation activities performed on the selected computer. In addition, this graph enables you to verify that auto–remediation is performed. |
| Top 5 Issues to Address | This section is available only when selecting a single computer, and displays the top five issues to address for the selected computer. |
| Results statistics | This section is available only when selecting a single computer and displays an overview of the audit result. Amongst others, the result enables you to identify the number of missing patches, number of installed applications, open ports and running services. |
| Security Sensors |
This section enables you to identify issues at a glance. Click a sensor to navigate and display issues and vulnerabilities for a specific computer or group. Sensors enable you to identify:
|
 Not installed - Agent is not installed on the target machine.
 Pending installation - Installation is pending. A status can be pending when the machine is offline or the agent is being installed.
 Pending uninstall - Uninstallation is pending. A status can be pending when the machine is offline or the agent is being uninstalled.
 Installed - Agent is installed on the target machine.
 Relay Agent Installed