View the number of hosts on a Dynamic Virtual Circuit
The Optimizer Shaping Report shows how each Circuit, Virtual Circuit, Dynamic Virtual Circuit and Policy performs over time. You can see how well your Policies are performing and exactly how much bandwidth each Policy is served. The "Average Rate" is the average policy throughput for the time specified in the time range. The "Current Rate" is the policy throughput averaged over the last 20 seconds.
- On your browser, open the Exinda Web UI (
https://Exinda_IPInternet protocol_address). - Key-in the User and Password.
- Click Login.
- Click Monitor > Control > Policies.
- Filter the charts by selecting the relevant Circuit, Virtual Circuit, and Policy. The charts are updated immediately to reflect these choices.
When the Virtual Circuit selected is a Dynamic Virtual Circuit, the following graph is displayed above the throughput graph.
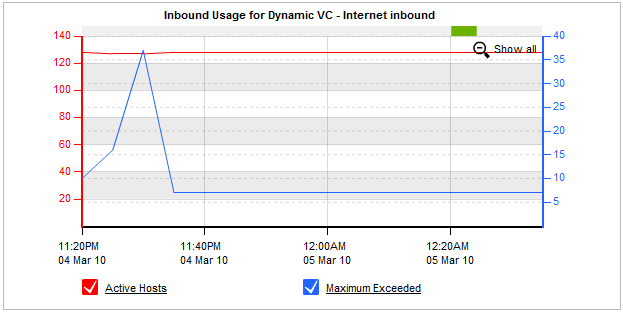
The number of Active Hosts for the selected Dynamic Virtual Circuit is represented by the red line.
The number of hosts that have exceeded maximum allowed hosts for this Dynamic Virtual Circuit is represented by the blue Maximum Exceeded line.