System dashboard
The System dashboard shows system information, the state of system alarms as well as a summary of other Exinda appliances and their respective reductionmeasures the amount of redundant data that has been removed from the network, increasing capacity statistics. The dashboard answers questions, such as "Are there any issues with the NICs, or CPU utilization, or SMB signed connections, etc? What is this appliance licensed for? What is this appliance's host ID? What is the reduction ratio between this appliance and others that it's accelerating with?"
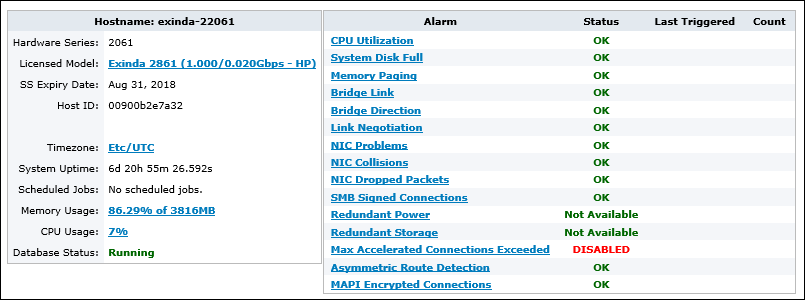
The system dashboard displays information about an Exinda Appliance and its peers.
The status of the appliance database is displayed as Database Status. The possible statuses include:
- Starting—The database is initializing, and it is waiting for a response from the system on available storage.
- Running—The database is operating.
- Upgrading—The database has started, but is being upgraded.
- Downgrading—The database has started, but is being upgraded.
- Stopped—The database is stopped.
- Error—The database cannot be accessed. This typically appears when there is a problem with the upgrade or downgrade of the database.
- Unknown—The state of the database is unknown.