Monitoring interface throughput
The Interfaces Throughput report shows throughput for a defined period of time for a particular interface or for all interfaces aggregated. This report answers questions such as:
- Is my link congested?
- Which bridge is congested?
- Was there a brief maximum burst or is the traffic consistently over average?”
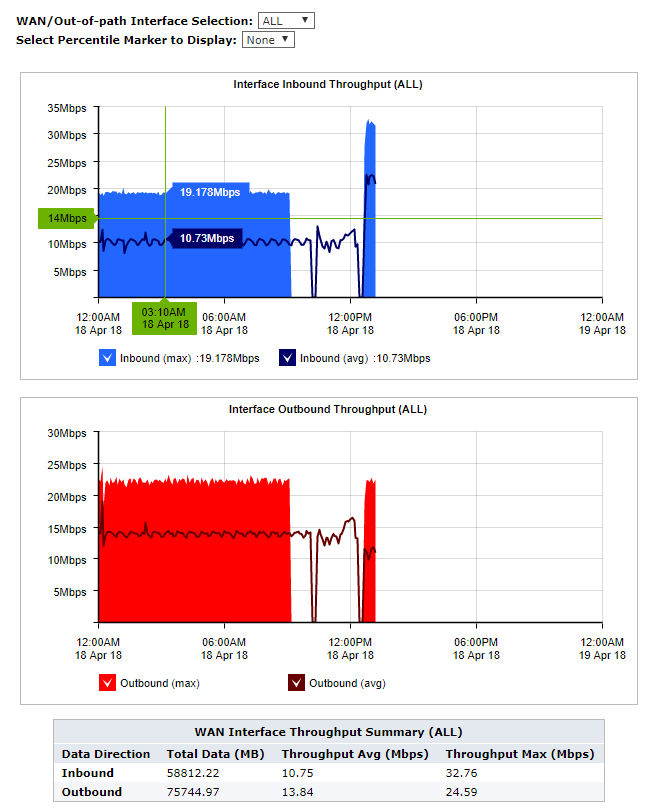
The throughput for inbound traffic is shown separately from outbound traffic. The charts show maximum throughput and average throughput.
Maximum throughput is determined by looking at 10 second samples of data. Average throughput is calculated by averaging the amount of data transferred over the time period specified by the granularity.
For instance, when looking at a day of traffic, each data point represents 5 minutes of data. The average shows the average data transferred over each 5 minute period. You can better understand the throughput distribution by adding a percentile marker line. The line shows that the nth percentile of (maximum) throughput observations exceeds the specified throughput rate. For instance, if the 95th percentile is at 55 Mbps, then 5 out of 100 maximum throughput observations appeared above 55 Mbps.
The table at the bottom of the report shows the total amount of data transferred into and out of the WANWide Area Network-side interface(s), and the maximum and average throughput rates for the selected time period.
NOTE
Because this report shows all data on the wire, it may include traffic not seen on the WAN, such as local LANLocal area network broadcasts, etc.
The Interface Throughput report displays inbound and outbound network traffic.
Where do I find this report?
To access this report:
- On your browser, open the Exinda Web UI (
https://Exinda_IPInternet protocol_address). - Key-in the User and Password.
- Click Login.
- Go to Monitor > Interfaces > Throughput.
Monitoring reports can be exported as a PDF document, saved as a scheduled report, or can be printed directly from the Web UI. For more information refer to Exporting, printing and scheduling reports.
To filter the data in the chart by bridge or out-of-path interface
Select the desired bridge (WAN interface), policy-based routing interfaces, or WCCP interface from the WAN/Out-of-path-Interface Selection selector. Selecting ALL includes all interfaces available.
To identify how much traffic falls above a specific percentile
Select the desired percentile level from the Select Percentile Marker to Display selector.