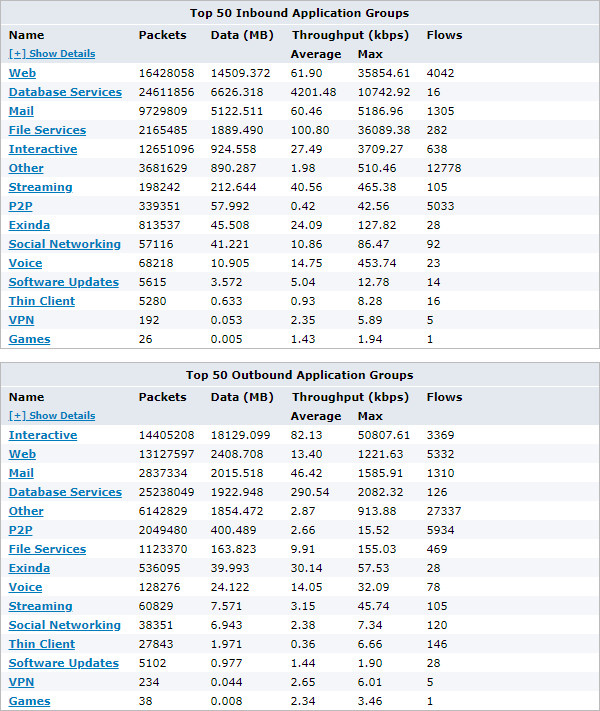
Viewing a network summary of application groups
Each table shows the top application groups together with the number of packets, number of flows data transferred and throughput statistics.
- On your browser, open the Exinda Web UI (
https://Exinda_IPInternet protocol_address). - Key-in the User and Password.
- Click Login.
- Click Monitor > Application Groups.
- To expose Round trip time, Normalized Delays, Transaction Delays, and Efficiency statistics for each Application Group, click Show Details.

- To view the data for individual applications within a group, click the application group name.