Dashboard
This General Status view is used to:
- View the status of the GFI EventsManager event processing engine
- Access statistical information such as the number of logon events, critical events and service status events.
To access the General view, go to Status tab > General.
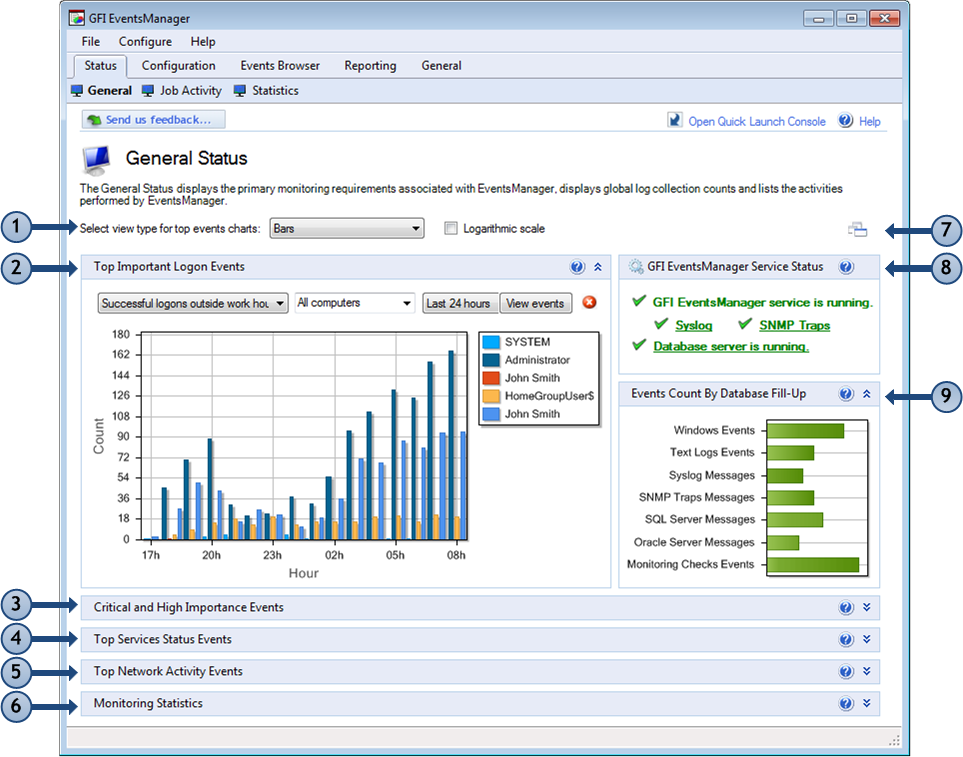
GFI EventsManager Status: General view
The General view consists of the sections described below:
| Section | Description |
|---|---|
| 1 |
Use this section to select the chart type for top events. |
| 2 |
The Top Important Log Events section provides statistical information about:
Events in this section are filtered by:
|
| 3 |
The Critical and High Importance Events section provides statistical/graphical information about critical events collected from all event sources. Here you can also view the vulnerability results monitored by GFI LanGuard. This graph shows the rules that collected and processed events for a particular period. From the drop down lists, select the type of information to display. Select from:
NOTE For detailed information about the different types of important events shown in this view, download the Microsoft® Security Monitoring and Attack Detection Planning Guide from http://go.gfi.com/?pageid=esm_smad_plan. |
| 4 |
The Top Service Status Events displays the top 10 services that caused the selected event. A service can generate events when:
The graph shows the frequency of these events sorted by service type and/or by computer generating the event. Select a machine or service from the drop down lists or key in the required criteria to customize the graph results. Note To collect services information, event sources must have Audit system eventsGenerates events when important system events happen such as user restarts or shuts down the target computer or when an event occurs that affects the security log. For more information, refer to http://technet.microsoft.com/en-us/library/cc782518(WS.10).aspx policy enabled. |
| 5 |
The Top Network Activity Events section displays details of the top 10 network activities (inbound and outbound) for computers running Microsoft®Windows® Vista or later. Network activity consists of all type of traffic generated by various protocols including SMTP, HTTP, FTP and MSN traffic. The network activities displayed can be filtered by: Select parameters from the drop down lists or key in the values to filter the type of chart displayed. Note To collect network activities, event sources must have Object auditingEnable this auditing feature to audit events of users accessing objects (example, files, folder and printer). For more information, refer to http://technet.microsoft.com/en-us/library/cc976403.aspx and Process tracking enabled. |
| 6 |
The Monitoring Statistics section displays status information about active Active Monitoring you are running on event sources. The information displayed in this section is refreshed every 20 seconds and you provides the:
Select a row and click View Events to view the pertaining logs that were generated when the check failed/succeeded. |
| 7 |
Click the Arrange Window icon to automatically fit all graphs in the management console. |
| 8 |
The GFI EventsManager Service Status is used to view:
Note
|
| 9 |
The Events Count By Database Fill-Up displays:
The bar color turns from green to red as the database is populated with events. |