Navigating the Events Browser

Events Browser
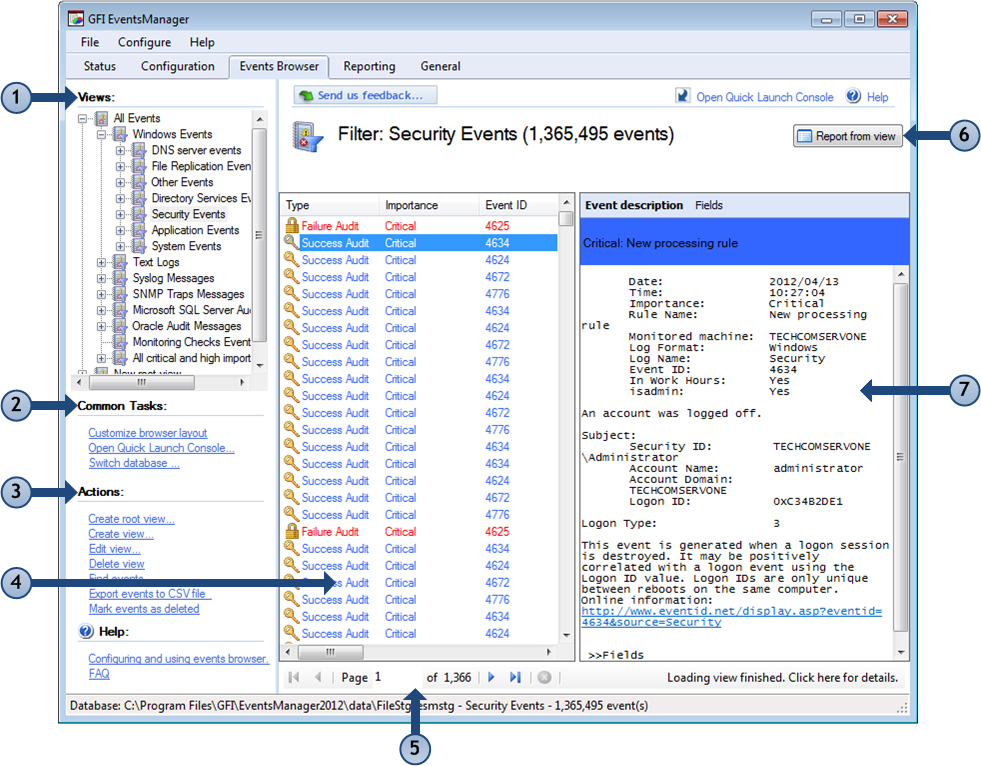
The Events Browser is made up of the following sections:
| Section | Description | |
|---|---|---|
| 1 | Views | The Views section includes a wide range of predefined views. Use this section to view specific logs such as Windows® Event Logs, Text Logs, SQL Server® audits and more. |
| 2 | Common Tasks | Common Tasks enable you to customize the look of the Events Browser and switch database to view exported and/or archived event logs. |
| 3 | ActionsThe activity that will be carried out as a result of events matching specific conditions. For example you can trigger actions whenever an event is classified as critical. Actions supported by GFI EventsManager include Email alerts, event archiving and execution of scripts. |
Use the Actions section to run common functions related to analyzing event logs. This enables you create or edit custom views, export events for further analysis and more. |
| 4 | Events | The Events section is used to browse through the events categorized under the selected view (from section 1). |
| 5 | Navigation controls | Use the navigation controls to browse through collected events. |
| 6 | Reporting |
The Report from view option enables you to generate graphical and statistical reports based on the selected view (from section 1). |
| 7 | Event Description Pane |
The Events Description Pane provides an extensive breakdown of the selected event (from section 4). Use this section to analyze the event details and find out when the event was generated, what was the cause and by whom it was generated. The header color coding enables you to quickly identify the severity of the event. The description section enables you to switch between two views:
The link provided in the event description gives you access to:
|