Statistics view
The Statistics view is used to display the daily event activity trends and statistics of a particular computer or entire network.
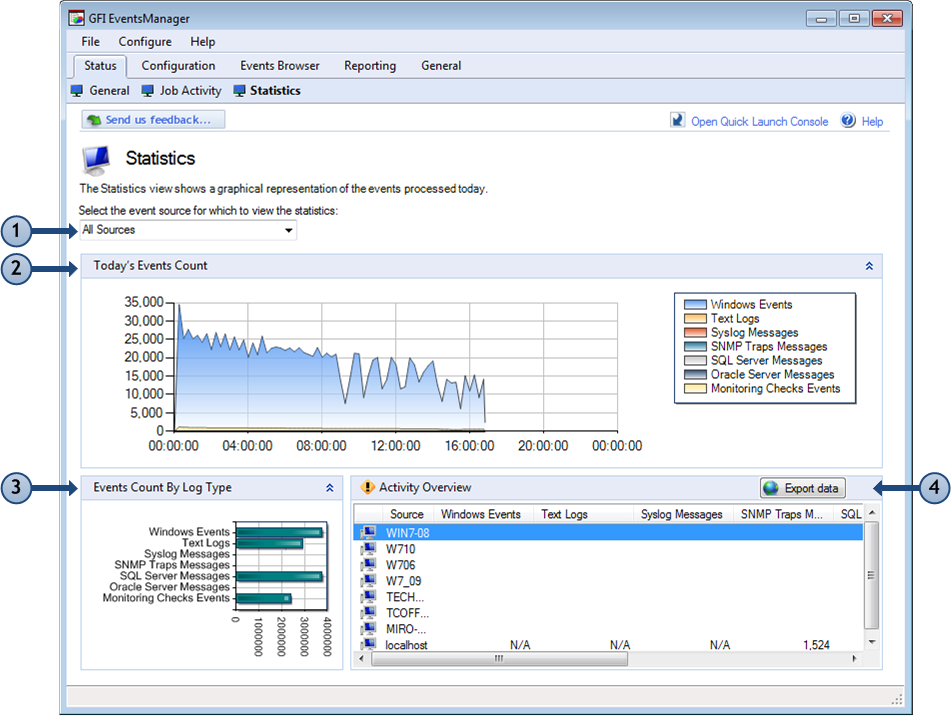
To access the Statistics view, go to Status tab > Statistics.
GFI EventsManager Status: Statistics view
The information provided in this view is divided into the following dedicated sections:
| Section | Description |
|---|---|
| 1 |
Use this drop-down menu to select what information is displayed. Select between All sources or select specific sources to view their information accordingly. |
| 2 |
The Today’s Events Count graphically represents the daily event collection trend on a machine by machine basis as well as on a network by network basis. A color scheme is used to differentiate between Windows®, Text Logs, Active Monitoring Logs, Syslog and SNMP TrapsNotifications/alerts generated and transmitted by active network components (Example: hubs, routers and bridges) to SNMP server(s) whenever important events such as faults or security violations occur. Data contained in SNMP Traps may contain configuration, status as well as statistical information such as number of device failures to date. events. |
| 3 |
The Events Count By Log Type represents the number of Windows®, Text Logs, Syslog and SNMP Traps events collected by GFI EventsManager from a particular machine or network. |
| 4 |
The Activity Overview section provides information about:
|