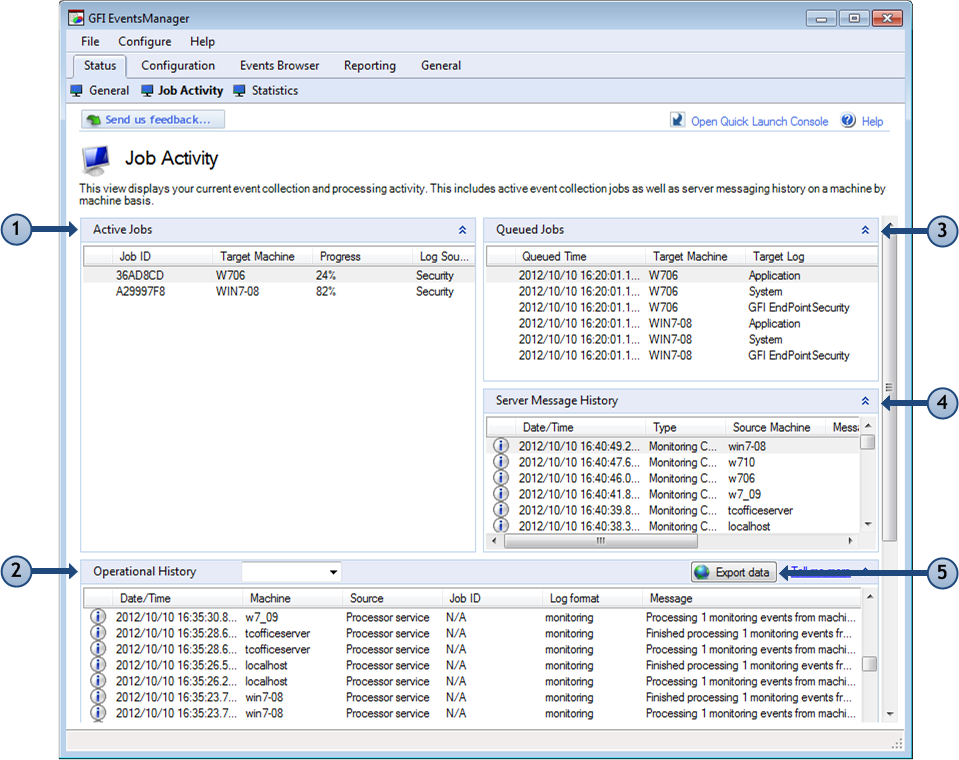
Job Activity view
This view displays your current event collection and processing activity. This includes active event collection jobs as well as server messaging history on a machine by machine basis.
To access the Job Activity view, go to Status tab > Job Activity.

GFI EventsManager Status: Job Activity view
The information provided in this view is divided into the following dedicated sections:
| Section | Description |
|---|---|
| 1 | The Active Jobs section provides a list of all event collection jobs currently taking place on every event source/machine. The information provided includes the job progress as well as the Log Source from which events are being collected. |
| 2 |
The Operational History section shows an audit trail of the event collection operations performed by GFI EventsManager. The information provided includes errors and information messages generated during the event collection process as well as the name of the log file that was being processed on the event source. NOTE Operational history logs can be exported using the Export data button. For more information refer to Generating reports. |
| 3 | The Queued Jobs section provides a list of all pending event collection jobs on a machine by machine basis. The information provided includes the event source from which events will be collected as well as the queuing time and type of log to collect. |
| 4 | The Server Message History section displays a list of all server messages (SNMP TrapsNotifications/alerts generated and transmitted by active network components (Example: hubs, routers and bridges) to SNMP server(s) whenever important events such as faults or security violations occur. Data contained in SNMP Traps may contain configuration, status as well as statistical information such as number of device failures to date. and Syslog) that were received by GFI EventsManager. The information provided includes the total number of messages sent by every event source, message count and the date/time when the last message was received. |
| 5 | Click Export data to generate Operational History reports. |