Central Management Server Dashboards
The dashboards in GFI LanGuard Central Management Server Console provide information related to issues, missing patches or updates, vulnerabilities and other important information that provide insight into the security status of your entire network. Click in the top navigation to access the overview page.
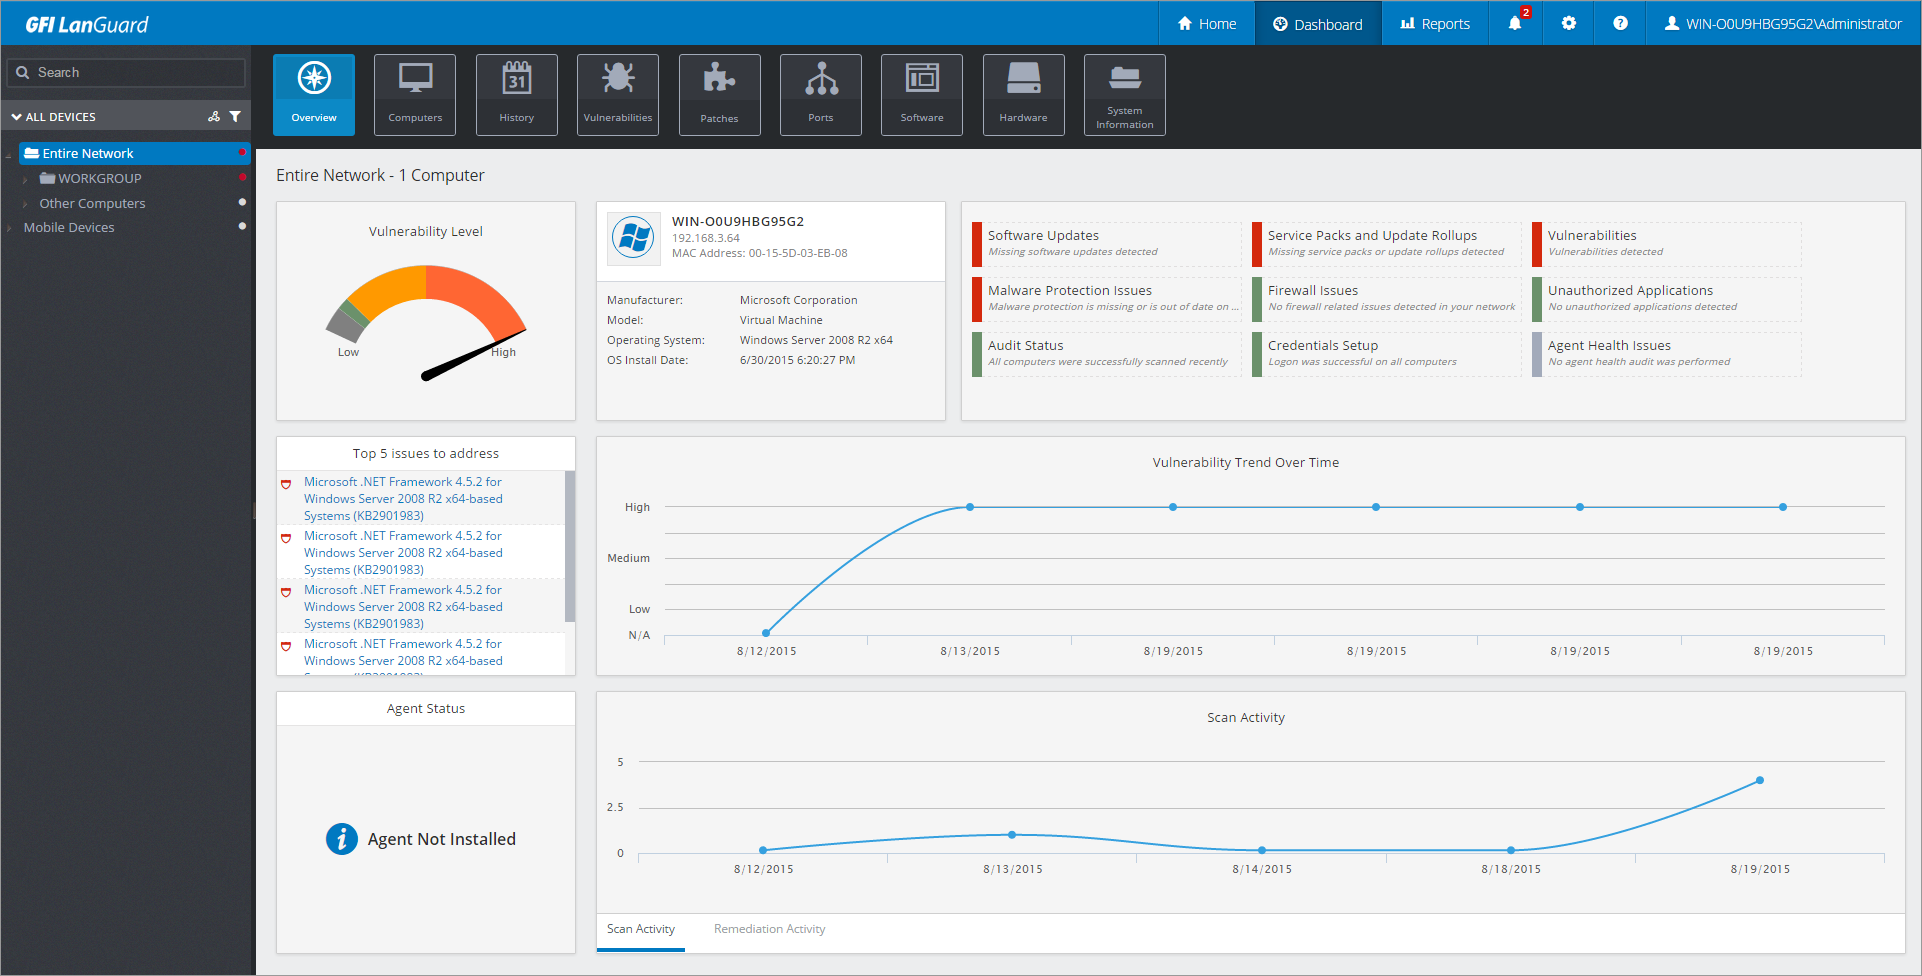
The overview dashboard
The Overview page is a dashboard that provides instant access to important information obtained from various GFI LanGuard installations. Information such as the vulnerability level of computers, domains or entire networks, missing updates alerts, vulnerability trends, top issues that need to be addressed and other data is displayed in one location for ease of access. Several additional dashboards that focus on specific features can be accessed by clicking the appropriate tabs in the upper part of the Console. These dashboards are described in the following table:
| Computers |
Select this dashboard to view information related to computers audited by GFI LanGuard. The Computers dashboard provides the discovered machine names, IP address, Domain name, installed Operating System and other relevant data. |
| History |
The History view shows the changes done to target computers between audits. The report includes changes related to vulnerability level, user accounts, groups, ports, shares and registry entries. Audit results can be filtered by date, grouped by computer, information category or date and exported in several formats. |
| Vulnerabilities |
A list of missing updates and types of vulnerabilities affecting your network. Select items from the list to display additional details. |
| Patches |
Displays a list of missing or installed patches and service packs found during a network audit. When a patch or service pack is selected from the list, the Details section provides more information on the selected item.
|
| Ports |
Displays details on open TCP or UDP ports found during a network audit. When a port is selected from the Port List, the Details section provides more information on the selected port. |
| Software |
A list of installed applications found during a network audit. When an application is selected from the Application List, the Details section provides more information on the selected application. |
| Hardware |
Displays more information on the hardware found during a network audit. Select hardware from the list to display more details. |
| System Information |
The System Information tab displays information associated with the operating system of a scan targets, such as users and groups, ongoing processes and services currently running. |
NOTE
When a computer or domain is selected, the results related to the selected computer/domain are automatically updated in the dashboard.