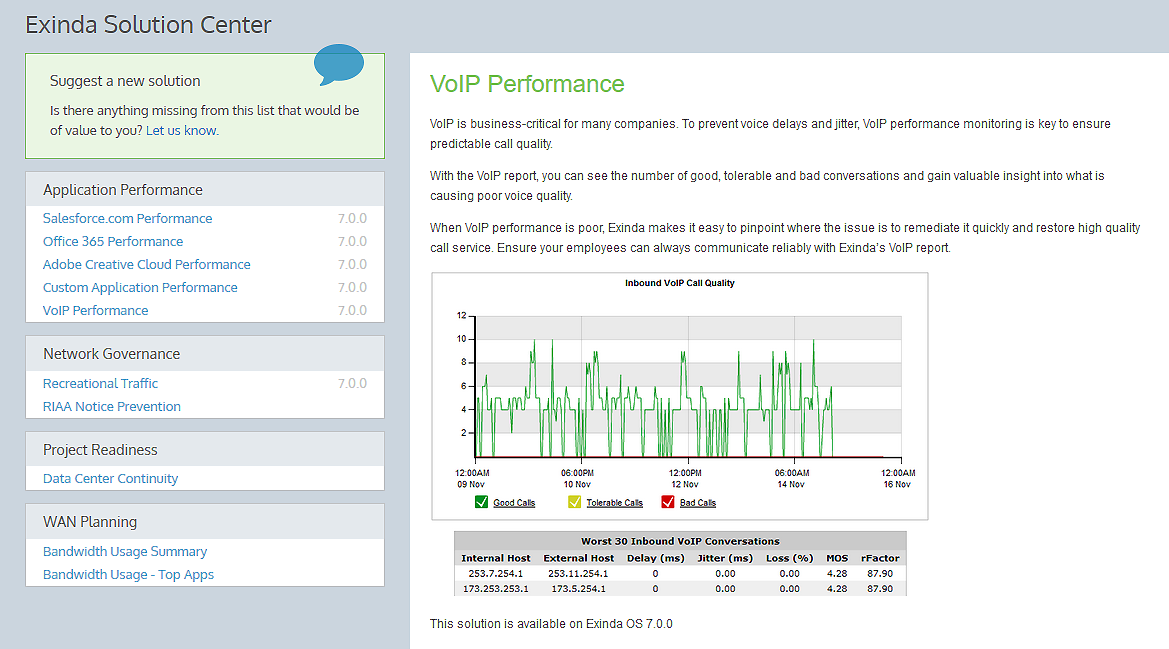
Monitoring applications with the Exinda Solution Center
The Exinda Solution Center provides a series of predefined monitors you can run to generate network performance reports for applications like FTP, SSH, Salesforce.com, Office365 VoIP and many more.
The generated reports answer questions, such as:
- How is salesforce.com performing for network users?
- How are critical applications performing on the network?
- How can I best mitigate data center disasters?
Each solution description indicates which Exinda OS version is required to run the solution, shown both in the solution list and in each solution description. You may need to upgrade your Exinda OS version to take advantage of the desired solutions. Some solutions may not yet be available and are shown as ‘Coming soon’.

The Exinda Solution Center
Performance monitors are divided into four solution categories: Application Performance, Network Governance, Project Readiness and WANWide Area Network Planning.
Each monitor has a description you can display by clicking the its link in the left panel. Descriptions detail usage information and which Exinda OS version is required to run the monitor. Some monitors also have short video descriptions.
 How performance reports work
An Exinda Appliance continuously collects network traffic data. Performance reports in the Exinda Solution Center provide insight into that data by grouping it in meaningful ways and displaying it in charts, tables and graphs.
The process starts by analyzing traffic and computing initial threshold values to create a baselineused by monitors and performance reports to establish a standard by which sunsequent performance can be measured. A baseline requires an hour's worth of network traffic data. If no traffic is observed for an application during a baselining period, the process continues until enough data is collected.
The baseline process may not take an hour. If an Exinda Appliance has observed and stored traffic for the application within the hour the baseline process starts, the baseline process uses that stored information and only waits enough time for a total hour of data to be collected.
For example, if you create an application monitor with ten minutes left in an hour and the Exinda captured network traffic for the application in that hour, the baseline process analyzes the previous fifty minutes of collected traffic data and completes the baseline period with data collected in the remaining ten minutes.