Performance tab
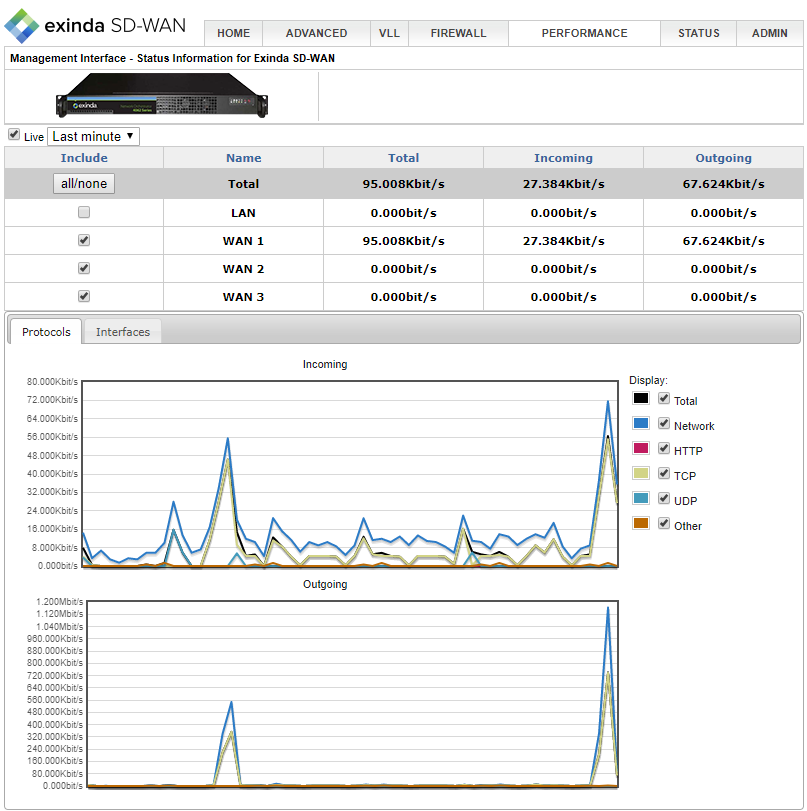
The Performance tab displays graphical performance metrics. A history of your traffic usage based on protocol, including total, network, HTTP, TCPTransmission Control Protocol, UDPUser Datagram Protocol, other, or interface, such as LANLocal area network or WAN1, are presented with multicolor graphs with a time scale from seconds, minutes, hours, days and months. There is also a check-box for live, realtime performance.
A typical example is shown below:

The Performance tab