WUI Guided Tour
Use the slide show below to get familiar with Exinda's web user interface. Click the arrows on the sides or swipe left/right to navigate through the slides.
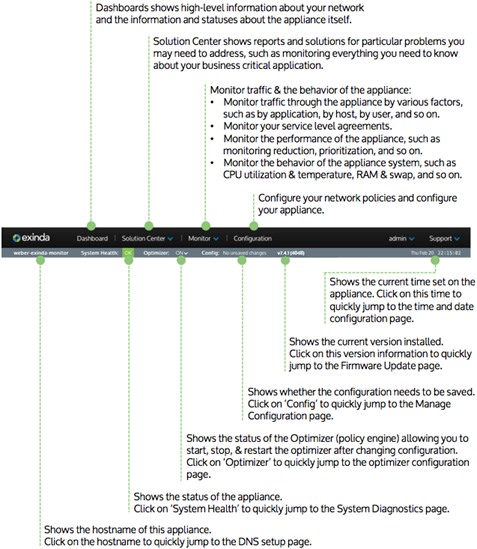
Menus and Status bar
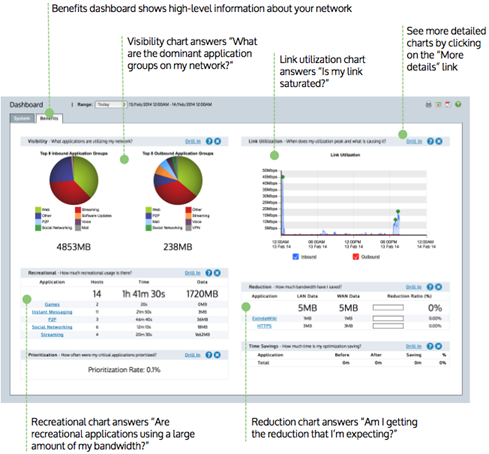
Dashboard Benefits
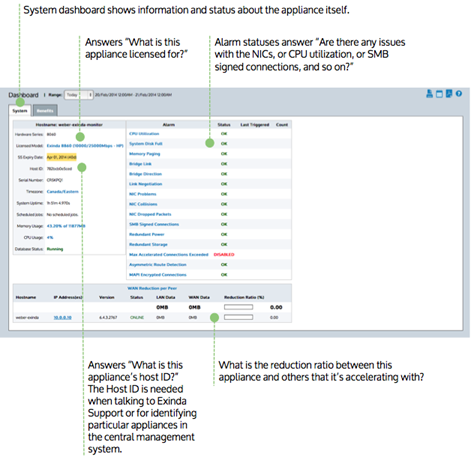
System Dashboard
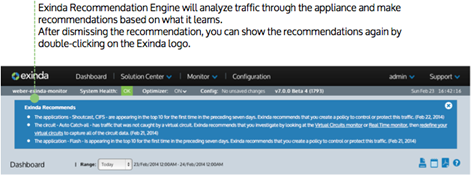
Recommendations
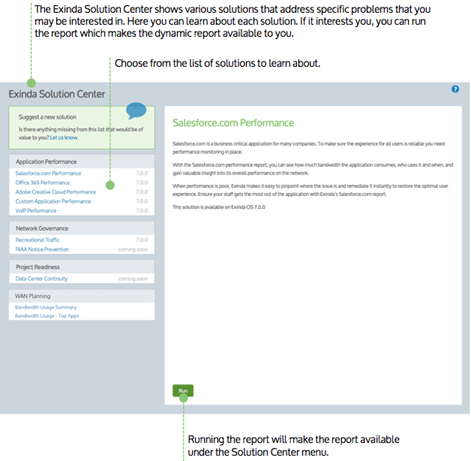
Solution Center
Policy Tree
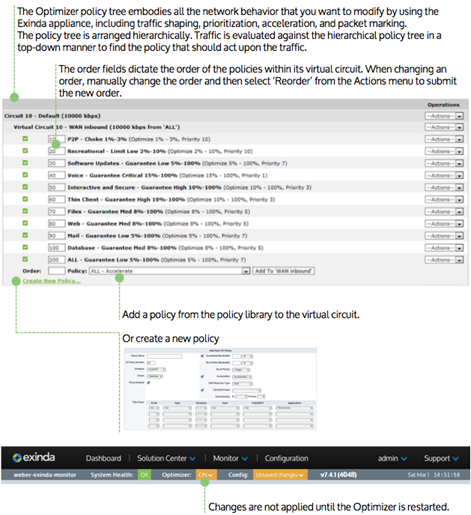
Chart Interactions – Time periods & PDF reports
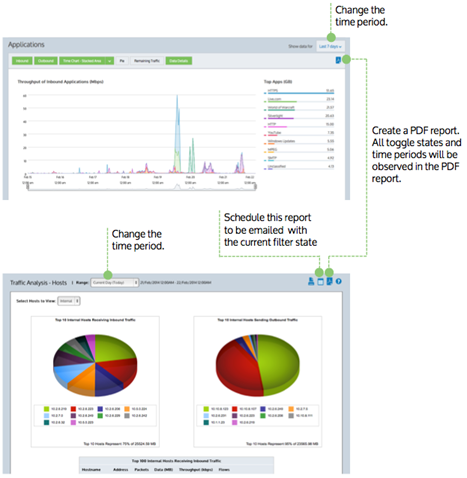
Chart Interactions – Zoom into date range
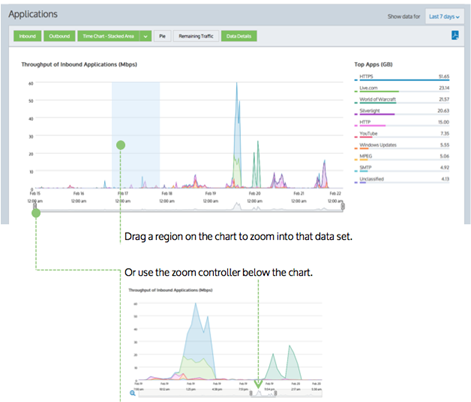
Chart Interactions – Drill-in and Data brush
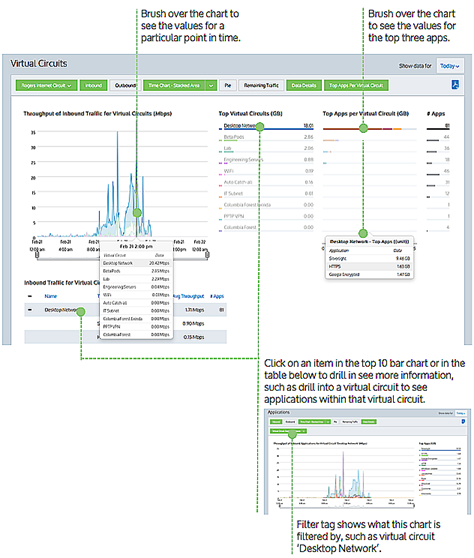
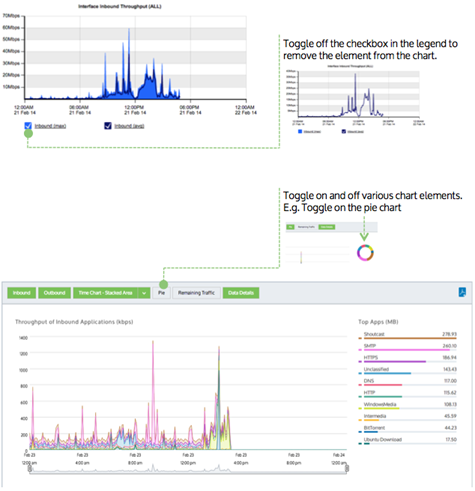
Chart Interactions – Toggle chart elements
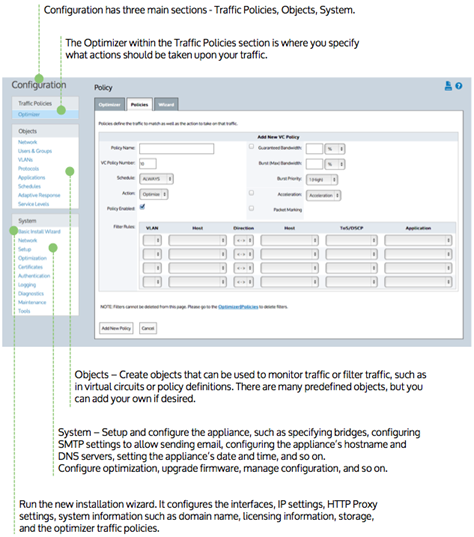
Configuration
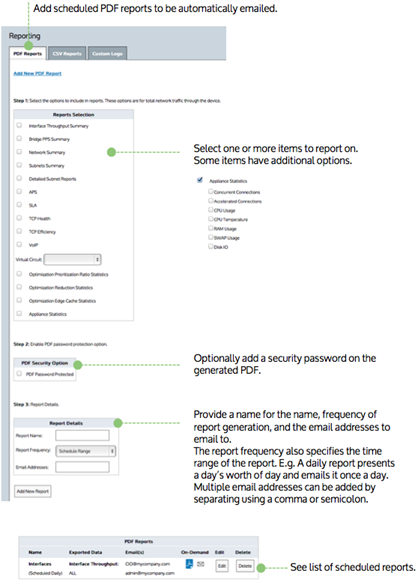
Scheduled Reports
Firmware Updates