Status and statistics

The GFI MailEssentials Dashboard
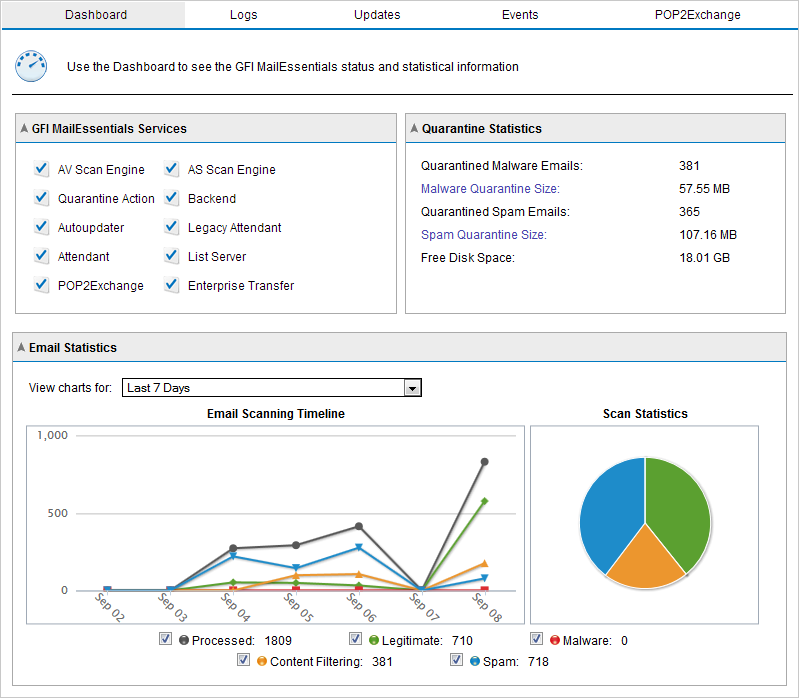
To open the Dashboard, go to GFI MailEssentials > Dashboard. This page displays statistics, status of services and a graphical presentation of email activity. More details on these sections are provided below.
 Services

The GFI MailEssentials Services
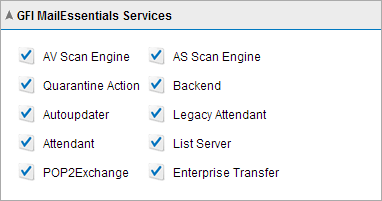
The Services area displays the status of GFI MailEssentials services.
-
 - Indicates that the service is started.
 -
 - Indicates that the service is stopped. Click this icon to start a stopped service.
You can also start or stop services from the Microsoft® Windows Services console. To launch the Services console, go to Start > Run, type services.msc and click OK.
 Quarantine Statistics

Quarantine statistics
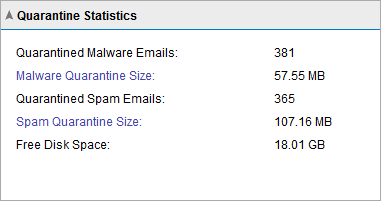
The Quarantine Statistics area displays the following statistical information:
 Charts

Dashboard charts
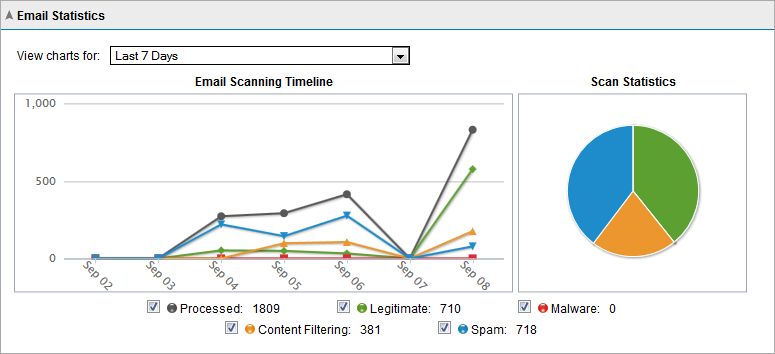
The Charts area displays graphical information about emails processed by GFI MailEssentials. Select the time period from the drop-down list to display information for that period in the charts.
| Area | Description |
|---|---|
| View charts for |
Enables you to select a period for which to view charts. Available options are:
|
| Email scanning timeline (time graph) |
Shows a time graph in intervals for the time period selected. The graph shows the number of processed, legitimate, malware, content filtering and spam emails. |
| Scan statistics (pie chart) | A graphical distribution of the total number of safe, quarantined and failed emails for the time period selected. |
|
Legend |
The legend shows the color used in graphs and the count of each category. |