Reading managerial statistics and reports in Kerio Control
Kerio Control can gather and display Internet statistics of all data (all Kerio Control users, non-authenticated users and guest users - see Special users in Kerio Control Statistics), for various user groups, and for all individual users in these groups. These statistics let you keep an eye on your subordinates' browsing activities. Ask your administrator for access and permissions.
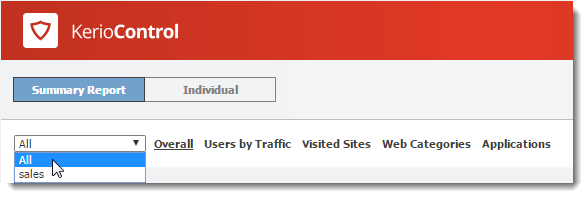
Once you have the permissions, you can see two tabs in Kerio Control Statistics:
- Summary Report, which lets you view statistics by user group.
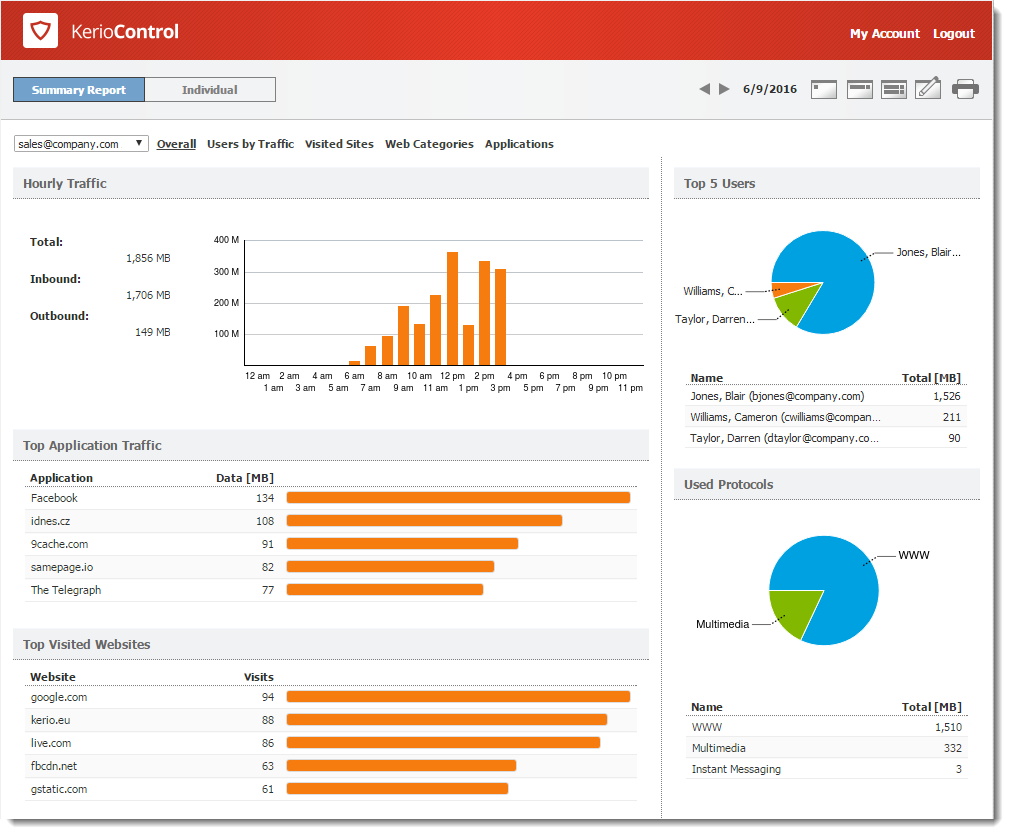
- Individual, which lets you select single users (or yourself) to see their statistics.
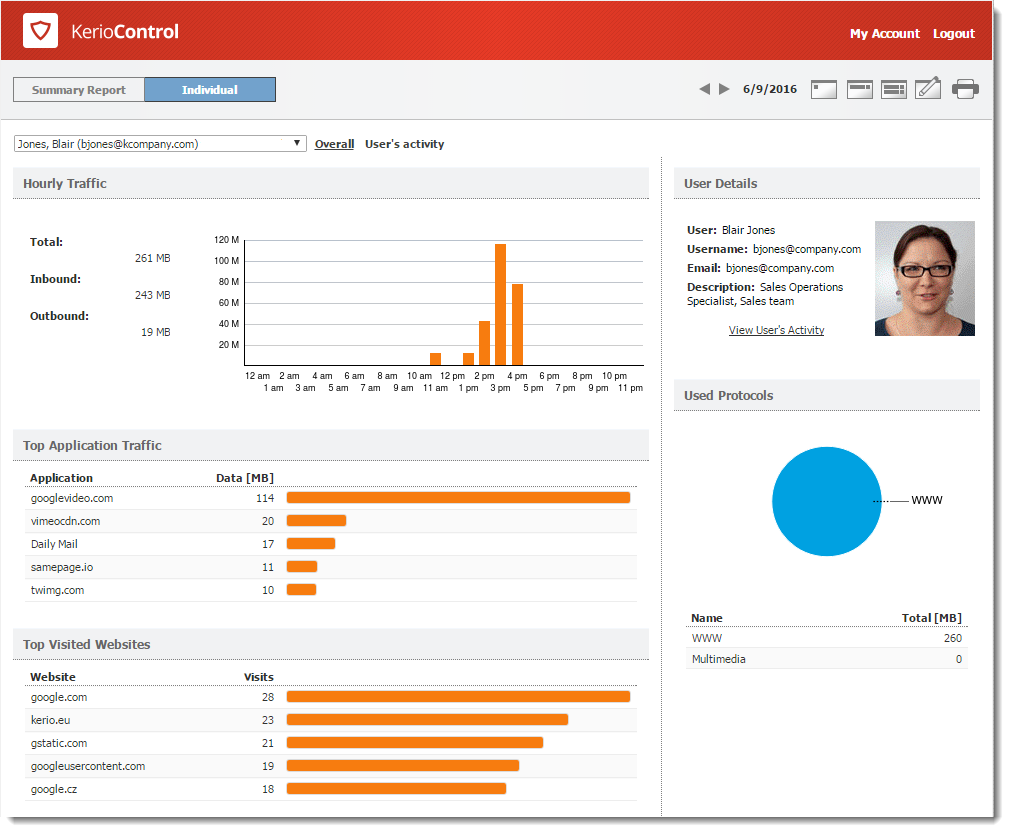
Reading the summary report
The Summary Report tab gives you an overview of the available user groups.
First, select a user group from the drop-down list.

Alternatively, choose All to see all users, including guest users and non-authenticated users. You need special permissions to see this group.
NOTE
The No data available alert informs you that no data is available in Kerio Control's database for the selected statistics and period (for example, the selected user account does not exist, the user does not log in to get through firewall, and so on).
The Summary Report tab has several additional tabs, as described below:
Overall tab
Hourly/Weekly/Monthly Traffic graph
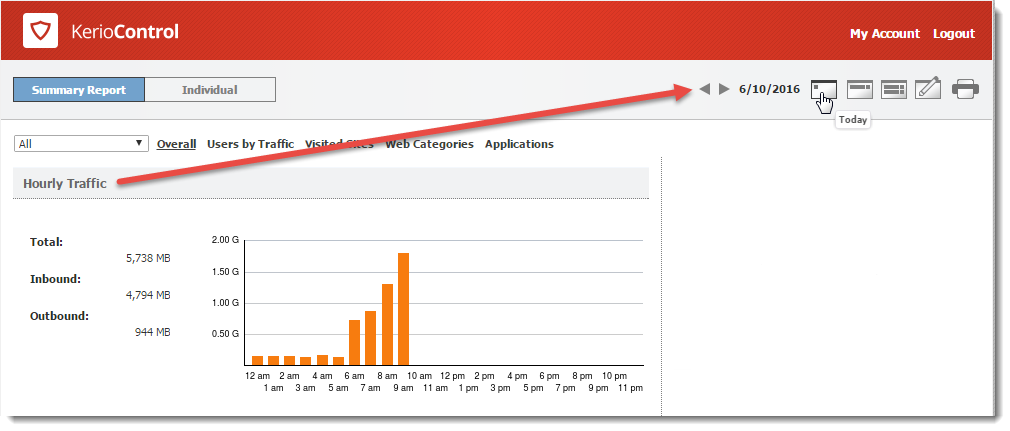
The first graph on the Overall tab provides information on the volume of data transferred within the selected period. When you move the pointer over the chart, you see information about data volumes transferred over the entire selected period (total and in each direction).
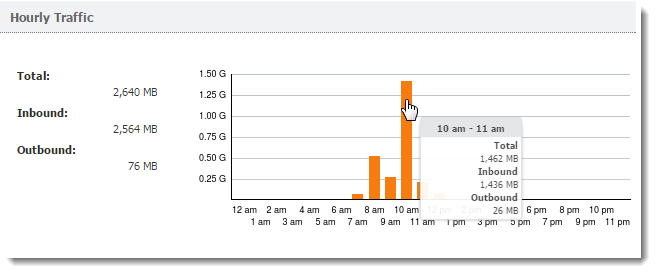
By default, the Hourly Traffic chart is set to show the current day. To change to the current week or month, use the toolbar in the upper right corner.
NOTE
The shortest period you can view is one day.
Top Application Traffic
The Top Application Traffic shows the five applications
that got the most traffic during the selected period.
For more information, click any application and Kerio Control Statistics takes you to the Applications tab, where you can see further details about the application.

Top Visited Websites graph
The Top Visited Websites chart shows the five domains ranked by visits. The numbers in the chart show how many visits were made to all pages on that domain during the selected period.

For more information, click the chart and Kerio Control Statistics takes you to the Visited Sites tab, where you can see further details.
Top Requested Web Categories graph
To see a chart of the most requested pages by category (such as
IT or lifestyle), click Web Categories. The Top
Requested Web Categories chart shows the top five categories
requested during the selected period,
The numbers in the chart reflect the total number of HTTPHypertext Transfer Protocol - protocol for exchange of hypertext documents in HTML. requests in the each category. Because the number may represent requests to multiple pages on a site. The number of requests is usually much higher than number of websites visited.
For more information, click the chart, Kerio Control Statistics takes you to the Web Categories tab, where you can see further details.
Top 5 Users graph
To see which users are using the largest amount of bandwidth, click Users by Traffic. The Top 5 Users chart shows the five users who transferred the greatest volume of data during the selected period.
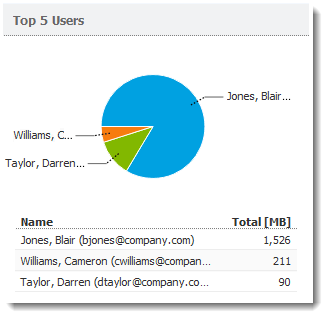
The chart includes individual users and the total volume of transferred data. Hover the pointer over a user's name to see the volume of data transferred by that user, in both total volume and by direction (download, upload).
To see statistics for a particular user, click the user's name in the chart. The results are displayed on the Individual tab.
NOTE
The total volume of data transferred by a particular user is sum of all data transferred by the user from all hosts connected to the firewall.
Used Protocols graph
The Used Protocols chart of shows the total volume of data transferred in the selected period.
Hover the pointer over a protocol to see the volume of data transferred by that protocol (see figure below).
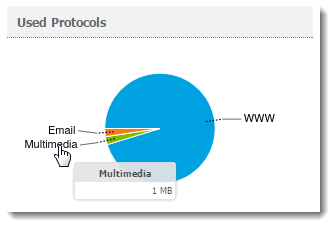
This chart helps you recognize the type of traffic going between the local network and the Internet. If the Internet line is overloaded, you can use this information to set necessary limits and restrictions (traffic rules, URL rules, and so on).
Users by Traffic tab
The Users by Traffic tab shows the volume of data transferred by individual users in the selected group in both directions (download, upload). You can choose between all network traffic and traffic statistics filtered by network protocol.
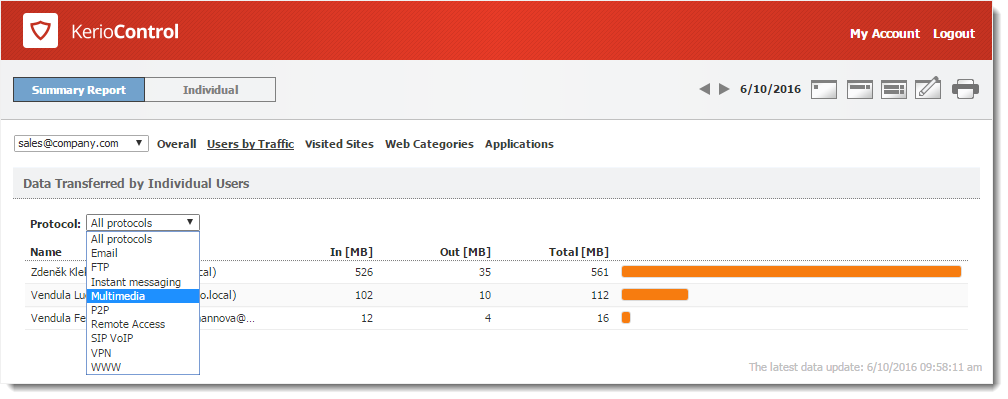
The table breaks down the total volume of transferred data by user. You can use the table to view all transferred data or only data transferred by a selected protocol (or protocol class). This allows you to get information about which users have transferred the most data via a particular service (for example, web browsing).
For better reference, Kerio Control sorts protocols by several predefined classes:
- Email: SMTP, IMAPInternet Message Access Protocol - One of the two most commonly used Internet standard protocols for e-mail retrieval, the other being POP3., POP3Post Office Protocol 3 - A protocol used by local email clients to retrieve emails from mailboxes over a TCP/IP connection. protocols and their secured versions.
- FTPFile Transfer Protocol - Protocol for transferring computer files from a server.: FTP protocol, including traffic over proxy server.
- Instant messaging: Online communication via services such as ICQ and Jabber.
- Multimedia: Protocols enabling real-time transmission of sound and video files, for example, RTSP, MMS, RealAudio.
- P2PPeer-to-Peer networks are worldwide distributed systems where each node can be used both as a client and a server.: Peer-to-peer file-sharing protocols, for example, DirectConnect, BitTorrent, eDonkey, and so on. The traffic is counted only if Kerio Control detects that it is traffic within a P2P network.
- Remote Access: Terminal access to remote hosts such as Remote desktop, VNC, Telnet or SSHSecure Shell - A cryptographic network protocol that enables you to connect securely over an unsecured network..
- SIPSession Initiation Protocol - Communication protocol used for voice and video calls in Internet telephony or private IP telephone systems.-VoIPVoice over Internet protocol - A digital telephone system that uses the internet as the transmission medium, rather than the PSTN.: Voice over telephony via SIP protocol.
- VPNVirtual private network - A network that enables users connect securely to a private network over the Internet.: Connection to remote private networks, for example, Kerio VPN, Microsoft PPTPPoint-to-Point Tunneling Protocol - A set of communication rules that allows to extend corporate network through private tunnels over public Internet., IPsecInternet Protocol security - A network protocol used to encrypt and secure data sent over a network..
- WWW: HTTP and HTTPSHypertext Transfer Protocol - version of HTTP secured by SSL. protocols and any other traffic served by the HTTP protocol inspector.
Visited Sites tab
The Visited Sites tab gives you an overview of web pages users have visited.
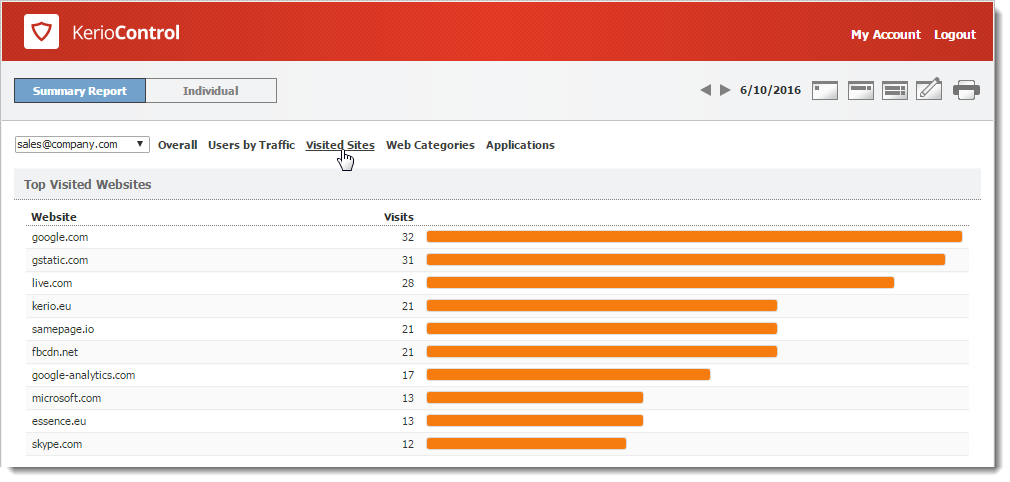
These statistics tell you things such as:
- What websites are visited by users regularly,
- Which users do the most browsing,
The chart at the top of the tab shows the most visited websites. The numbers in the chart reflect the number of visits to all pages on the site in the selected period.
Beneath the chart, you can see detailed statistics for each of the top ten websites.
Web Categories tab
The Web Categories tab gives an overview of popular web categories for the selected period.
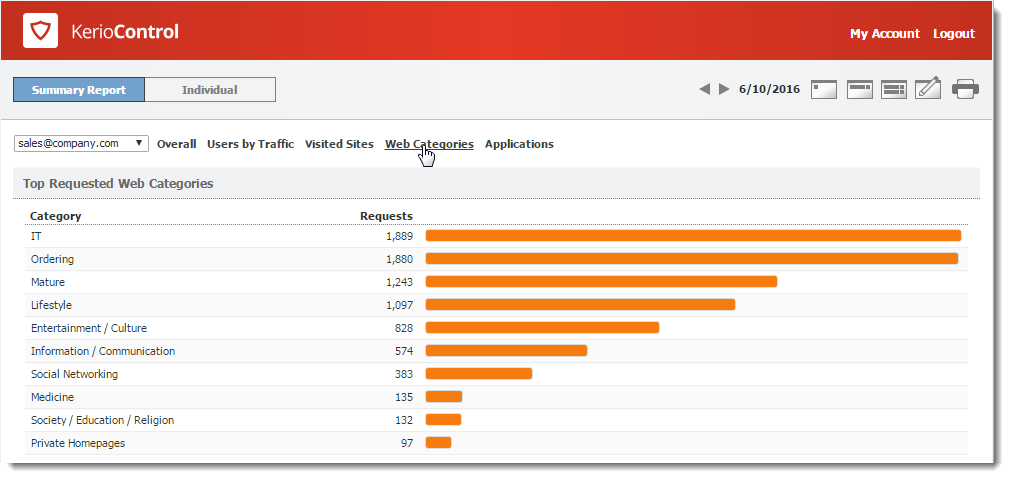
The numbers in the chart show the total number of HTTP requests in each category. Because a number may include requests to multiple pages on a site. The number of requests is usually much higher than the number of visits shown for the top visited websites.
Beneath the chart, Kerio Control Statistics shows detailed statistics for each of the top 10 web categories.
NOTE
Web categorization is performed by Kerio Control Web Filter, an optional module of Kerio Control. To use web categories in your statistics, you need a valid license.
Applications tab
NOTE
New in Kerio Control 9.1!
If your organization uses Application awarenessA part of next generation firewall which allows you to identify and filter traffic according to particular applications., the top ten web applications recognized by the Application awareness module are displayed. For more information refer to Application awareness in Kerio Control.
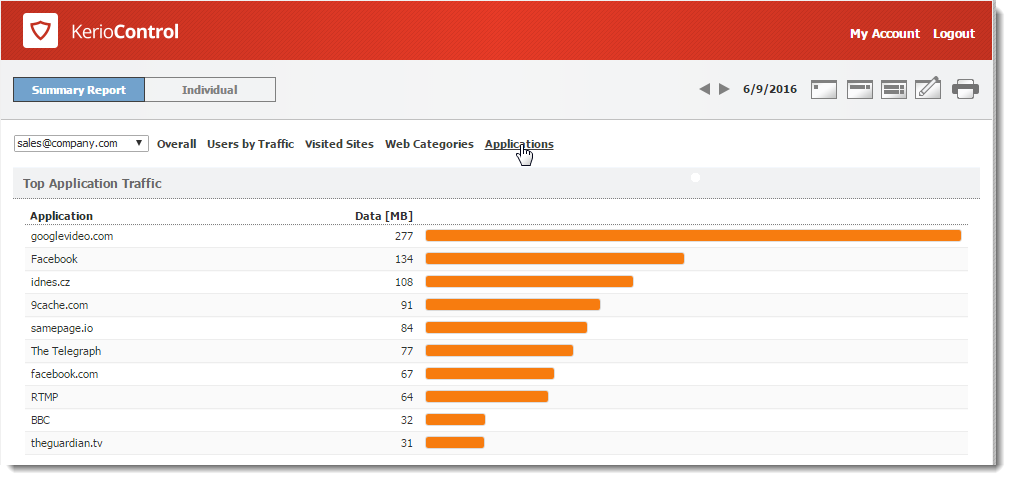
Beneath the chart, Kerio Control Statistics shows detailed statistics for each of the top 10 applications. You can see, for example, who uses each application from the top ten.
NOTE
Application visibility is performed by Application awareness, an optional module of Kerio Control. To see Applications in your statistics, you need a valid license.
Reading individual statistiscs
To see detailed statistics for a particular user, click the user's name in a chart or table to switch to the Individual tab. Alternatively, you can click the Individual tab on the main page and choose a user's name from the drop-down list.
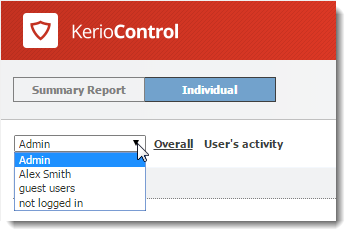
The charts and tables in Kerio Control Statistics provide useful information on which users use the Internet connection the most and make it possible to set necessary limits and quotas.
For more information refer to Viewing activity reports in Kerio Control Statistics.
Special users in Kerio Control Statistics
Except for your Kerio Control users and groups, you can see in the user list two more special users:
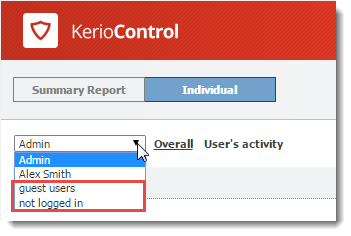
- guest users > Kerio Control gathers statistics for the guest network under the built-in guest users account.For more information refer to Configuring the guest network.
- not logged in > Kerio Control gathers statistics for traffic which does not belong to any logged in user. For example:
- firewall,
- traffic rule enabling web access to certain pages without login,
- user traffic if you do not require user authentication when accessing web pages. For more information refer to Authenticating users to Kerio Control.