Monitoring Kerio Connect
In Kerio Connect, you can:
- Monitor incoming and outgoing messages
- View connections to services, number of messages
- View statistics (including antivirus and spam filter)
- View who's connected
- Monitor the CPU and RAM usage
Monitoring incoming and outgoing messages
All messages sent or received through Kerio Connect are stored in Kerio Connect installation directory in folder store/queue.
Kerio Connect stores the messages as the following files:
- The
*.emlfile is the message itself. - The
*.envfile is the SMTPSimple Mail Transport Protocol - An internet standard used for email transmission across IP networks. envelope of the message.
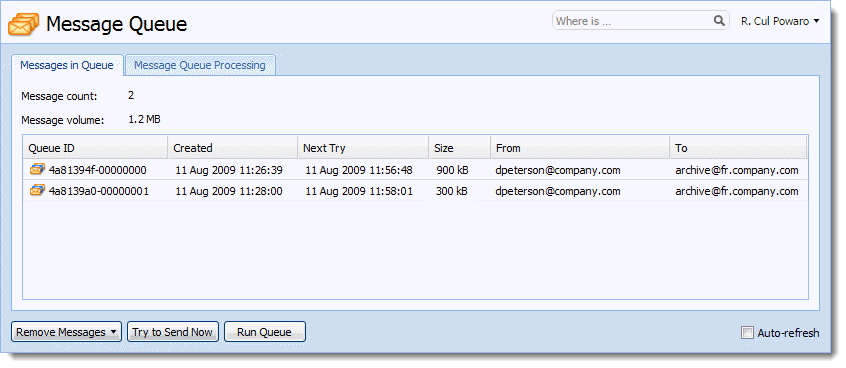
Viewing the messages in queue
Go to Status > Message Queue > Messages in Queue tab to view messages in queue.
In this section you can:
- Verify whether messages are sent/received properly.
- Remove messages from the message queue.
- Immediately send messages waiting in the queue.
NOTE
The Queue ID displayed in Status > Message Queue > Messages in Queue refers to the filename in store/queue.
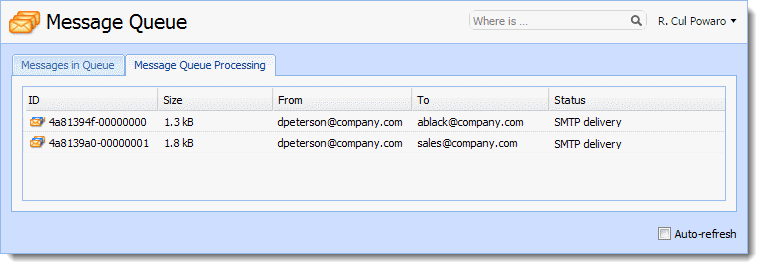
Processing message queue
When processing the message queue, Kerio Connect creates a new process for each message. This process reports all actions (such as delivery to a local mailbox or a remote SMTP server and antivirus control) and then terminates.
Multiple processes can run simultaneously.
Go to Status > Message Queue > Messages Processing to view the status of messages that are currently being processed.
Configuring message queue parameters
In the administration interface, go to Configuration > SMTP Server > Queue Options tab.
Here you can specify:
- The maximum number of messages being delivered at a time.
- The interval in which Kerio Connect retries to deliver messages.
- The interval in which Kerio Connect sends the undelivered messages to senders.
- The interval in which senders are notified that their messages have not been delivered.
NOTE
These settings do not apply if you use a relay SMTP server.
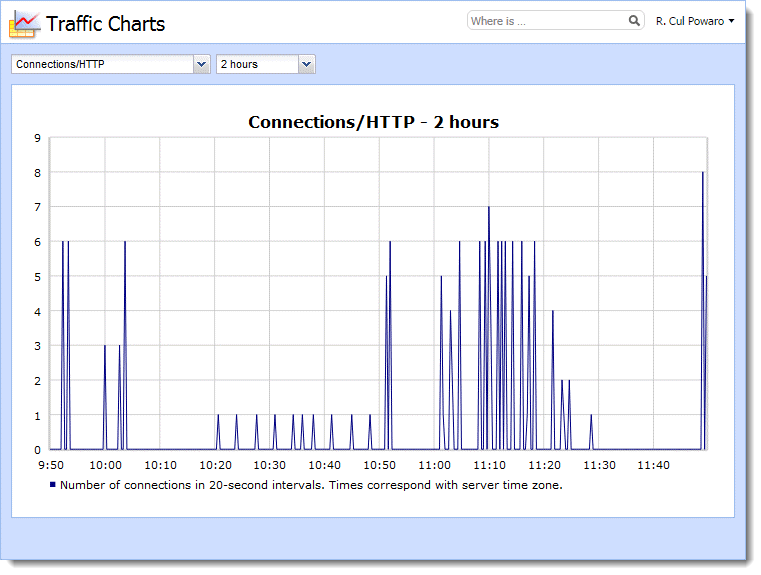
Traffic charts
In the Kerio Connect administration interface, go to Status >Traffic Charts. Here you can view the number of connections to individual services of Kerio Connect and the number of processed messages (both incoming and outgoing) for a given period in graphical format.
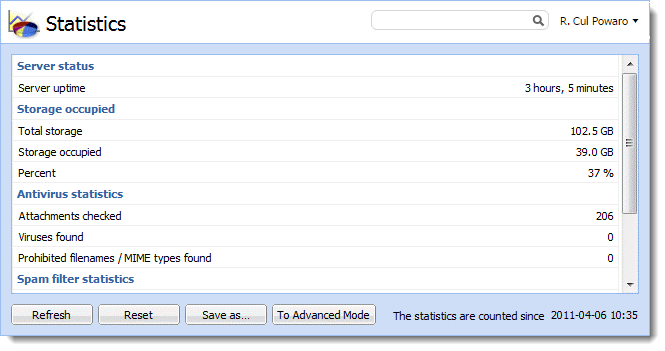
Viewing statistics
In the Kerio Connect administration interface, go to Status > Statistics to view the Kerio Connect statistics.
The statistics are divided into groups, for example, Storage Occupied, Messages sent to parent SMTP server, Client POP3Post Office Protocol 3 - A protocol used by local email clients to retrieve emails from mailboxes over a TCP/IP connection. statistics, and so on.
Displaying users currently connected to Kerio Connect
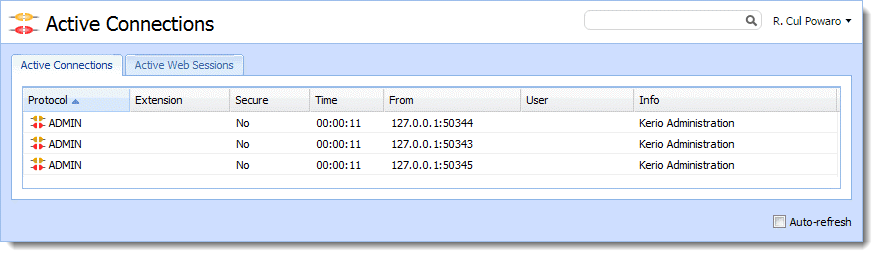
Go to Status > Active Connections to view all network connections established with the server.
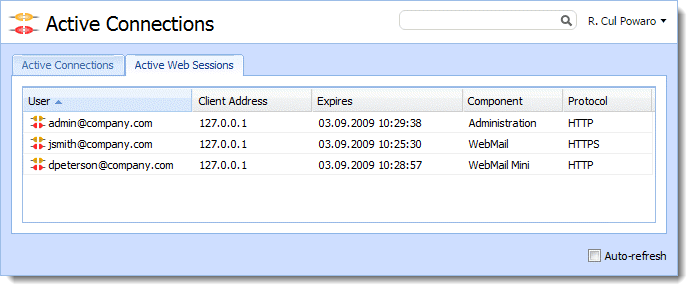
To display connections established to Kerio Connect's web interfaces and session expiry times, go to Status > Active Connections > Active Web Sessions.
Kerio Connect also allows you to view which email folders are being used by the users.
To display currently opened folders, go to Status > Opened Folders.
Monitoring CPU and RAM usage
Go to Status > System Health to view the current usage of CPU, RAM and the disk space on the machine where Kerio Connect is installed.
| Details | Description |
| CPU usage |
Timeline of the computer's CPU load. Short time peak load rates can be caused, for example, by the network activity. |
| RAM usage |
RAM usage timeline. |
| Storage Usage |
Currently used space and free space on the disk or a memory card. |
You can also choose a Time Interval and view the CPU and RAM usage details according to it.
Additionally, lack of system resources may seriously affect the functionality of Kerio Connect. If these resources are permanently overloaded, click Tasks> Restart and then check storage usage again.