Viewing activity reports in Kerio Control Statistics
Kerio Control Statistics is a web interface where you can view your own browsing statistics.
NOTE
If you have sufficient access rights, you can also see other users' statistics. For more information refer to Reading managerial statistics and reports in Kerio Control.
The statistics show traffic between the local network and the Internet. They do not include volumes of data transferred between local hosts and web pages on local servers.
Statistics are primarily used to create reports for a specified period. Gathering and evaluating statistics requires processing large volumes of data. To reduce the load on the firewall, the data is updated hourly, so, you cannot use Kerio Control Statistics for real-time monitoring of user activity.
For more information refer to Managing your Kerio Control Statistics account.
Accessing the web interface
To open Kerio Control Statistics:
- Launch your web browser and type your Kerio Control address. The address has this pattern:
https://server:4081/whereserverrefers to the name or IP addressAn identifier assigned to devices connected to a TCP/IP network. of Kerio Control, and4081represents a web interface port.
WARNING
If your browser displays a warning about a certificate invalidity, continue.
For more information, contact your Kerio Control administrator.
- On the Kerio Control Statistics login page, type your Kerio Control username and password. If you do not know your credentials, contact your administrator.

- Click Login.
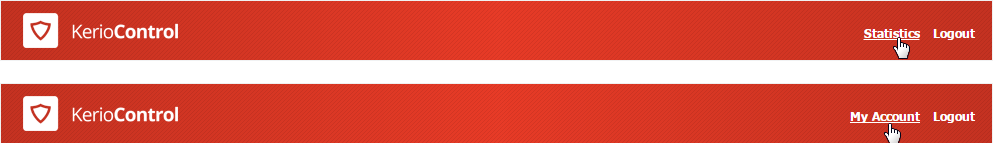
Switching between Kerio Control Statistics and account settings
Kerio Control Statistics has two parts:
- Statistics displays statistics and your Internet activities.
- My Account lets you change your password, set 2-step verificationSecurity authentication which includes two steps, which includes password and a special time-limited code., and check your browsing quota.
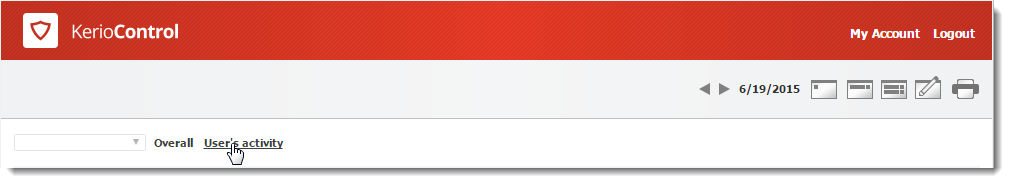
Use the option in the upper right corner to switch to the other part of the interface.
Displaying Kerio Control Statistics
Selecting the period to view
By default, Kerio Control Statistics displays the current day. To change the time period, use the toolbar at the upper right of the page.
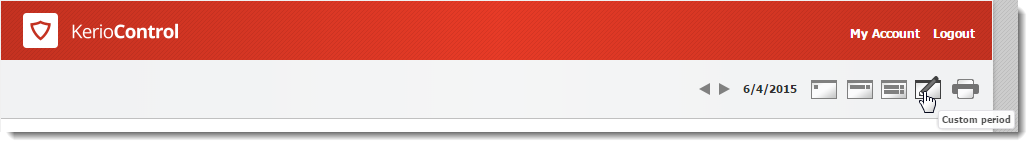
The toolbar includes buttons for switching between the daily, weekly, monthly views. The previous and next arrows to the left of those buttons allow you to jump quickly from one view to the next.
NOTE
The starting day of the week and month can be changed. Contact your administrator for details.
Printing
To print any page of the statistics, click the Print button.
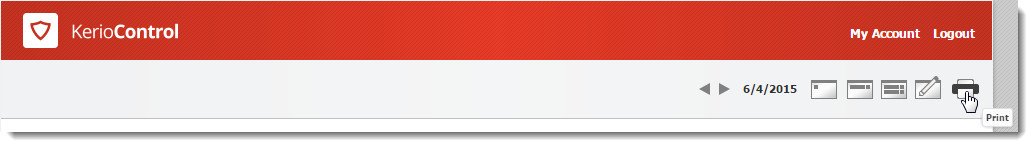
Clicking Print displays the current page on a new tab in a printable format.
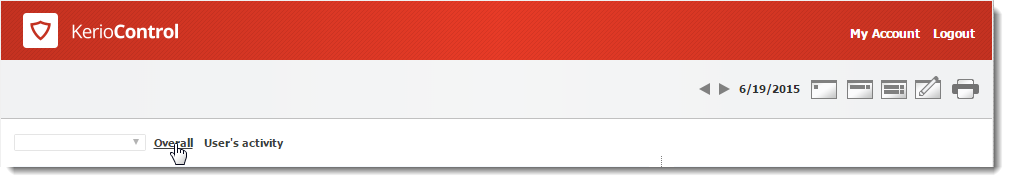
Overall tab
NOTE
The No data available alert informs that no data is available in Kerio Control's database for the selected statistics and accounting period. This status can be caused by various different reasons — for example, the selected user account does not exist in the particular time period, the user have not logged in to the firewall within the period, and so on.
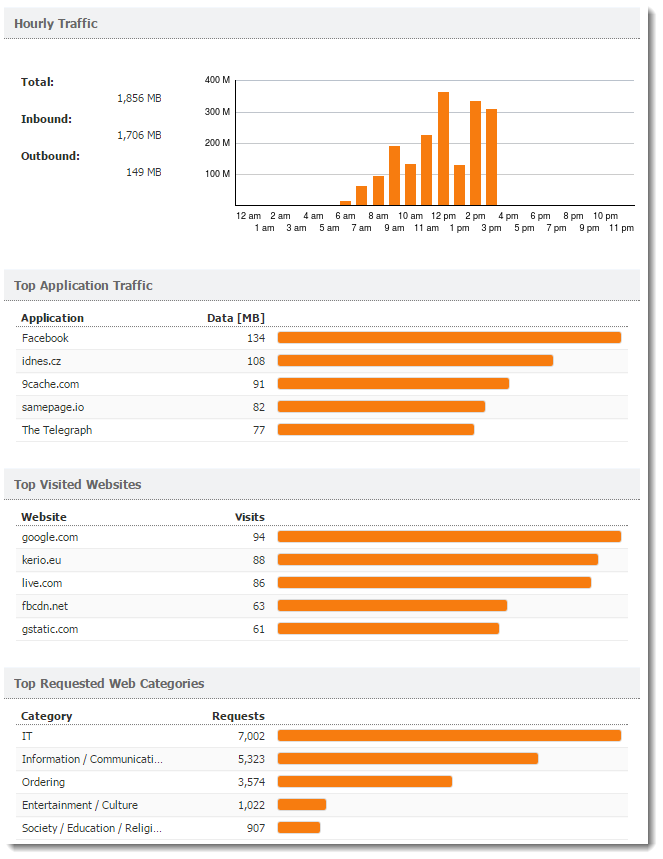
The Overall tab includes information about:
- Hourly/Weekly/Monthly Traffic — You can change the time period in the tool bar.
- Top Application Traffic — The five applications
that got the most traffic during the selected period.
- Top Visited Web Sites — The five sites that got the most traffic during the selected period.
- Top Requested Web Categories — The five categories that were most often viewed during the selected period.
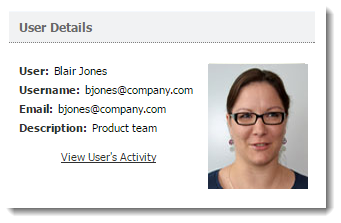
- User Details — Your user information stored in Kerio Control.
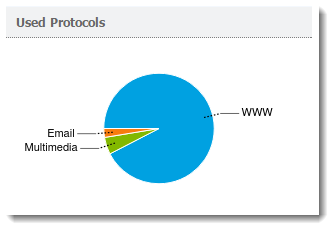
- Used Protocols — The Used Protocols pie chart is shown if you uses web, multimedia, VoIPVoice over Internet protocol - A digital telephone system that uses the internet as the transmission medium, rather than the PSTN., email, and so on.
Reading the User's activity tab
NOTE
The User's Activity tab is visible only if Kerio Control gathers users' activity records. For more information refer to Configuring statistics and reports.
The User's activity tab shows detailed information about your browsing activities. You can see:
- What you were doing on the Internet during the selected period
- How much time you spent browsing web pages
Gathering and evaluating statistics requires processing large volumes of data. To reduce the load on the firewall, the data is updated hourly, so, you cannot use Kerio Control Statistics for real-time monitoring of activity.
NOTE
If No data available is shown then no data is available in Kerio Control's database for the selected statistics and accounting period. This status can be caused by various different reasons — for example, the selected user account does not exist in the particular time period, the user have not logged in to the firewall within the period, and so on.
Activity Categories
Activity categories are ranked in the order shown here. If there was no activity in a category in the selected period, that category is omitted.
- Web pages
- Messaging, which includes email communication (SMTP, IMAPInternet Message Access Protocol - One of the two most commonly used Internet standard protocols for e-mail retrieval, the other being POP3., and POP3Post Office Protocol 3 - A protocol used by local email clients to retrieve emails from mailboxes over a TCP/IP connection. protocols) and instant messaging
- Large file transfers, for example, archives, installation media, and so on
- Multimedia, such as video sharing sites, online radio and television channels (streaming)
- VoIP — SIPSession Initiation Protocol - Communication protocol used for voice and video calls in Internet telephony or private IP telephone systems. (Internet telephony)
- Remote access, such as VPNVirtual private network - A network that enables users connect securely to a private network over the Internet..