Activity
Use the Activity tab to monitor device usage across the network and logged events for a specific computer or for all network computers.
The Activity section contains information about:
Activity Log
This sub-tab allows you to monitor the devices in use on the network. Select the computer and/or user from the relevant drop-down lists to filter the Activity Log list by computer and/or by user. In addition, this tab allows you to further filter down the list by the provided time filters.
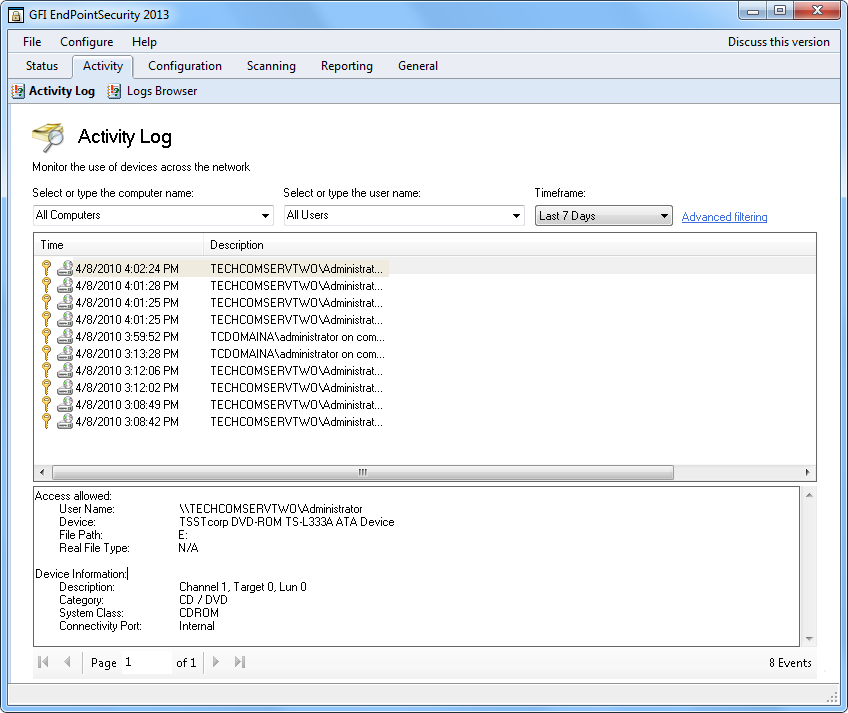
Activity Log sub-tab
To access the Activity Log sub-tab, from GFI EndPointSecurity management console click Activity tab > Activity Log.
To view more details about a particular event, click on the event. Additional information is displayed in the events description pane at the bottom of the sub-tab.
To customize the Activity Log sub-tab to suit your company’s needs, right-click the header and select the columns that should be added to or removed from the view.
To change a column’s position, select the column header, drag and drop it at the required position.
Advanced Filtering
This feature allows you to further filter down the device usage history logs using one or more criteria from the following set:
- Application Path
- File path
- Device
- Event type.

Activity Log sub-tab - Advanced filtering
To access advanced filtering options of Activity Log, click Advanced filtering in the Activity Log sub-tab.
Logs Browser
The Logs Browser sub-tab allows you to access and browse events currently stored in the database backend.
GFI EndPointSecurity also includes a query builder to simplify searching for specific events. With the events query builder you can create custom filters that filter events data and display only the information that you need to browse - without deleting records from your database backend.
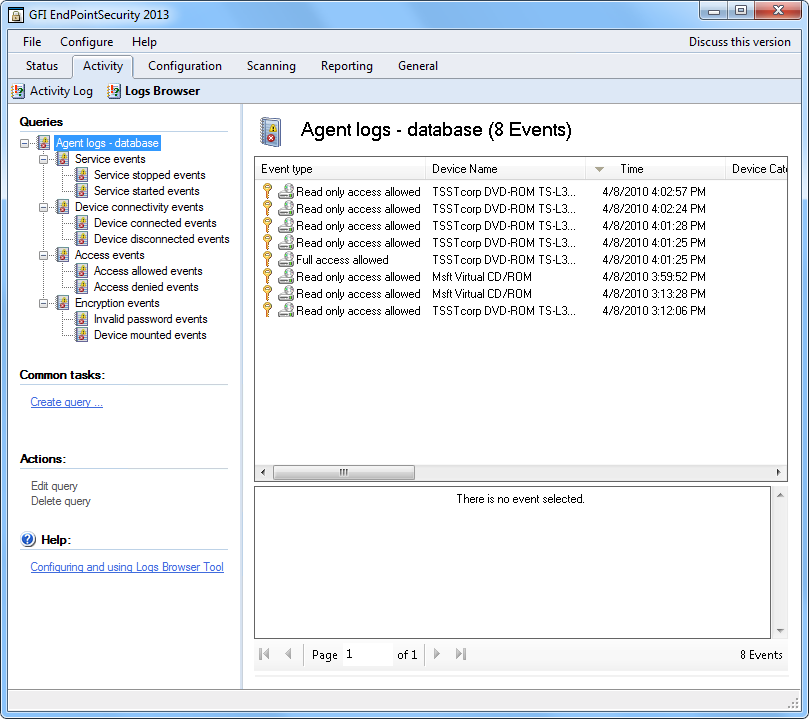
Logs Browser sub-tab
To access the Logs Browser sub-tab, from GFI EndPointSecurity management console click Activity tab > Logs Browser.
To view more details about a particular event, click on the event. Additional information is displayed in the events description pane at the bottom of the sub-tab.
Creating event queries
To create custom event queries:
- From GFI EndPointSecurity management console, click Activity tab.
- Click Logs Browser sub-tab.
- In the left pane, right-click Agent logs - database node and select Create query….
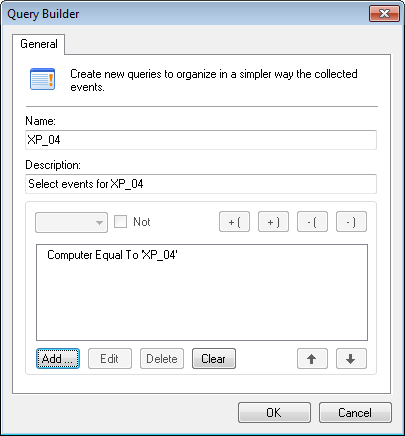
Query Builder options
- In the Query Builder dialog, specify a name and a description for the new query.
- Click Add…, configure the required query condition(s) and click OK. Repeat until all required query conditions have been specified.
- Click OK to finalize your settings. The custom query is added as a sub-node within Agent logs - database node.
Note
You can also filter the results of existing event queries by creating more specific sub-queries. To do this right-click on a query and select Create query….